Foodservice Methodology
Scope Boundary
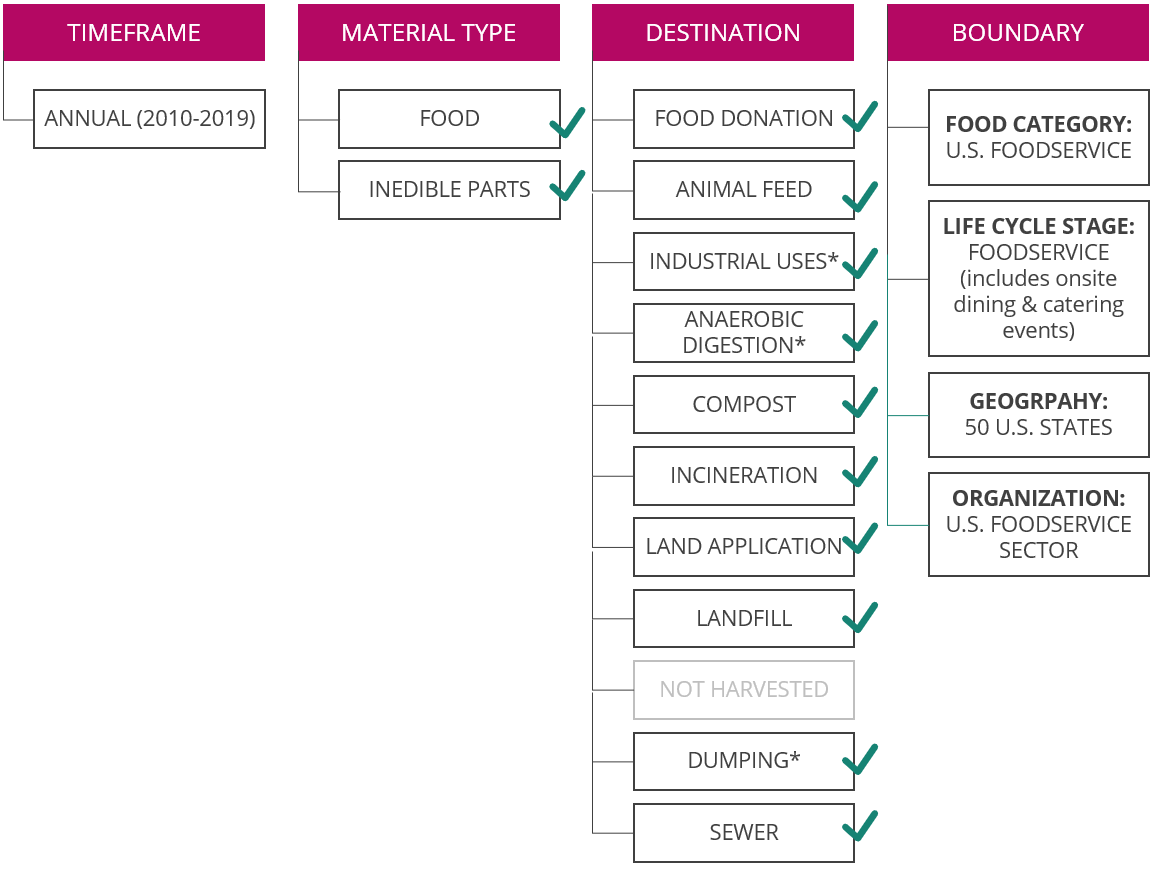
This diagram communicates the scope boundary as aligned with the Food Loss and Waste Accounting and Reporting Standard[17]. Note that ReFED’s analysis also includes food sent to donations, although donations are not considered a destination within the Standard.
- NOTES
“Food Donation” has been added as a Destination
“Biomaterial Processing is referred to as “Industrial Uses” in our model
“Co/anaerobic digestion” is referred to as “Anaerobic digestion” in our model
“Controlled Combustion” is referred to as “Incineration” in our model
“Refuse/discards” is referred to as “Dumping” in our model
Calculations
Surplus Food Calculations
In ReFED’s data model, the following calculations are repeated for every state, year, and foodservice segment before any aggregation is done.
DATA ITEM |
DATA SOURCE OR CALCULATION |
EXAMPLE |
|
|---|---|---|---|
SUPPLIER PURCHASES AND CUSTOMER SALES |
|||
National Purchases from Suppliers |
Technomic Ignite Platform[44] |
$32,802,753,378 U.S. Burger location purchases from suppliers and distributors |
|
National US Dollars Sold |
Technomic Ignite Platform[44] |
$99,542,847,400 U.S. Burger location sales |
|
State % Share of Supplier Purchases |
= # State Locations for Top 500 Restaurants[44] / # US Locations for Top 500 Restaurants[44] |
11.44% of U.S. Burger locations in Texas |
|
% In-scope Igredients |
ReFED Calculation
See Appendix O for more information
|
ReFED estimates that 93.71% of menu ingredients are in-scope food ingredients (e.g., excludes soft drinks, bottled water, etc.)
|
|
US Dollars State Supplier Purchases |
= National Purchases from Suppliers * State % Share of Supplier Purchases * % In-scope Ingredients |
= $32,802,753,378 U.S. Burger location purchases * 11.44% Texas market share * 93.71% in-scope
= $3,517,642,650 estimated Burger location purchases in Texas
|
|
US Dollars Sold |
= National Purchases from Suppliers * State % Share of Supplier Purchases * % In-scope Ingredients |
= $99,542,847,400 U.S. Burger location sales * 11.44% Texas market share * 93.71% in-scope
= $10,674,596,780 estimated Burger location sales in Texas
|
|
Wholesale Price per Lb |
ReFED Calculation
See Appendix O for more information
|
ReFED estimates that the average wholesale price of food for Burger locations in 2021 was $1.72 per lb. |
|
State Tons Supplier Purchases |
= US Dollars State Supplier Purchases / Wholesale Price per Lb / 2,000 Lbs per ton |
= $3,517,642,650 state supplier purchases / $1.72 per lb / 2,000 lbs per ton
= 1,024,190 tons of food purchased from suppliers for Burger locations in Texas
|
|
Pre-Consumer Surplus Rate |
LeanPath[30] |
4.20% of food spend not utilized by kitchens |
|
Tons Sold |
= State Tons Supplier Purchases * ( 100% - Pre-Consumer Surplus Rate ) |
= 1,024,190 tons of food purchased from suppliers * (100% - 4.20% )
= 981,174 tons sold to customers at Burger locations in Texas
|
|
PRE-CONSUMER FOOD SURPLUS |
|||
Tons Pre-Consumer Surplus
Includes both unutilized ingredients and overproduction
|
= State Tons Supplier Purchases * Pre-Consumer Surplus Rate |
= 1,024,190 tons food purchased from suppliers * 4.20% surplus rate
= 43,015 tons pre-consumer surplus at Burger locations in Texas
|
|
% of Pre-Consumer Surplus that is Overproduction |
LeanPath[30] |
48.05% of pre-consumer surplus for the Limited Service Restaurants sector is due to overproduction. |
|
Tons Overproduction |
= Tons Pre-Consumer Surplus * % of Pre-Consumer Surplus that is Overproduction |
= 43,015 tons pre-consumer surplus * 48.05% overproduction
= 20,669 tons Overproduction
|
|
Average Menu Retail Price per Lb |
= US Dollars Sold / Tons Sold / 2,000 lbs per ton |
= $10,674,596,780 sold / 981,174 tons sold / 2,000 lbs per ton
= $5.44 retail value per lb sold
|
|
US Dollars Overproduction |
= Tons Overproduction * Average Menu Retail Price per Lb
Note: Overproduction is valued at retail rather than wholesale price, because it is ready to sell to a customer.
|
= 20,669 tons overproduction * $5.44 retail value per lb sold * 2,000 lbs per ton
= $224,873,195 overproduction
|
|
Tons Unutilized Ingredients |
= Tons Pre-Consumer Surplus - Tons Overproduction |
= 43,015 tons Pre-Consumer Surplus - 20,669 tons Overproduction
= 22,346 tons unutilized ingredients at Limited Service Restaurants locations in Texas
|
|
US Dollars Unutilized Ingredients |
The following calculation was performed for each menu ingredient, as wholesale prices vary for each ingredient:
= Tons Unutilized Ingredients * % of Menu Comprised of Ingredient * Ingredient Wholesale Price per Lb * 2,000 lbs per ton
|
Total sum of all unutilized ingredients:
= $76,749,967
|
|
CATERING OVERPRODUCTION |
|||
Breakdown of Sales by Customer Distribution Channel |
Technomic Ignite Platform[44] |
For Burger locations in 2021:
Take-out: 77.25%
Onsite Dining: 16.41%
Catering: 6.34%
——————-
Total: 100%
|
|
% Catering Overproduction |
ReFED Expert Interviews
See Appendix Q for more information
|
Experts estimate that 38% of food is typically left unserved at breakfast or lunch catering events. |
|
Tons Catering Sold |
= Tons Sold * % Catering |
= 981,174 tons sold * 6.34% of sales is catering
= 62,159
|
|
Tons Catering Overproduction |
= Tons Catering Sold * % Catering Overproduction
Note: All Catering Overproduction was listed as “Prepared Foods” in the Food Waste Monitor.
|
= 981,174 tons sold * 6.34% of sales is catering * 38% food left unserved at events
= 23,620 tons catering overproduction from Limited Service Restaurants locations in Texas
|
|
US Dollars Catering Overproduction |
= US Dollars Sold * % Catering * % Catering Overproduction |
= $10,674,596,780 sold * 6.34% of sales is catering * 38% food left unserved at events
= $256,978,084 catering overproduction from Limited Service Restaurants locations in Texas
|
|
PLATE WASTE |
|||
Average Menu Retail $ per Lb |
= US Dollars Sold / Tons Sold / 2,000 lbs per ton |
= $99,542,847,400 / 1,024,190 tons / 2,000 lbs per ton
= $5.44/lb
|
|
Plate Waste Rate |
Plate Waste Studies[__citation_platewaste_Roe__],[__citation_platewaste_Massow__],[__citation_platewaste_PSU__],[__citation_platewaste_Folger__],[__citation_platewaste_Smith__]
See Appendix P for plate waste rates used for each type of foodservice.
|
In the plate waste study relevant to Limited Service Restaurants locations, 11.30% of food served became plate waste
|
|
Tons Onsite Food Served |
= Tons Sold * % Onsite Dining |
= 981,174 * 16.41%
= 161,055 tons served at Limited Service Restaurants locations in Texas
|
|
US Dollars Onsite Food Served |
= Tons Onsite Food Served * Average Menu Retail $ per Lb * 2,000 lbs per ton |
= 161,055 tons served * $5.44/lb * 2,000 lbs per ton
= $1,752,193,541 served at Limited Service Restaurants locations in Texas
|
|
Tons Catering Served |
= Tons Catering Sold - Tons Catering Overproduction |
= 62,159 tons catering sold - 23,620 tons catering overproduction
= 38,538 tons catering served from Limited Service Restaurants locations in Texas
|
|
US Dollars Catering Served |
= Tons Catering Served * Average Menu Retail $ per Lb * 2,000 lbs per ton |
= 38,538 tons catering served * $5.44/lb * 2,000 lbs per ton
= $419,280,032 catering served from Limited Service Restaurants locations in Texas
|
|
Tons Onsite Plate Waste |
= Tons Onsite Food Served * Plate Waste Rate |
= 161,055 * 11.30% food served becomes plate waste
= 18,199 tons onsite plate waste from Limited Service Restaurants locations in Texas
|
|
Tons Catering Plate Waste |
= Tons Catering Served * Plate Waste Rate |
= 38,538 tons catering served * 11.30% food served becomes plate waste
= 4,354 tons catering plate waste from Limited Service Restaurants locations in Texas
|
|
US Dollars Onsite Plate Waste |
= US Dollars Sold * % Onsite Dining * Plate Waste Rate |
= $10,674,596,780 sold * 16.41% of sales is onsite dining * 11.30% food served becomes plate waste
= $197,997,870 onsite plate waste from Limited Service Restaurants locations in Texas
|
|
US Dollars Catering Plate Waste |
= US Dollars Catering Served * Plate Waste Rate |
= $419,280,032 catering served * 11.30% food served becomes plate waste
= $47,378,643 catering plate waste from Limited Service Restaurants locations in Texas
|
|
Total Tons Plate Waste |
= Tons Onsite Plate Waste + Tons Catering Plate Waste
Note: All Plate Waste was listed as “Prepared Foods” in the Food Waste Monitor.
|
= 18,199 tons onsite plate waste + 4,354 tons catering plate waste
= 22,554 tons total plate waste from Limited Service Restaurants locations in Texas
|
|
Total US Dollars Plate Waste |
= US Dollars Onsite Plate Waste + US Dollars Catering Plate Waste |
= $197,997,870 onsite plate waste + $47,378,643 catering plate waste
= $245,376,513 total plate waste from Limited Service Restaurants locations in Texas
|
|
TOTAL FOOD SURPLUS |
|||
Tons Food Surplus |
= Tons Overproduction + Tons Pre-Consumer Surplus (excluding Overproduction) + Tons Plate Waste (including Onsite Dining and Catering) + Tons Catering Overproduction |
= 20,669 tons onsite overproduction + 22,346 tons unutilized ingredients + 22,554 tons total plate waste + 23,620 tons catering overproduction
= 89,190 tons food surplus from Limited Service Restaurants locations in Texas
|
|
US Dollars Food Surplus |
= US Dollars Overproduction + US Dollars Pre-Consumer Surplus (excluding Overproduction) + US Dollars Plate Waste (including Onsite Dining and Catering) + US Dollars Catering Overproduction |
= $224,873,195 overproduction + $76,749,967 unutilized ingredients + $245,376,513 total plate waste + $256,978,084 catering overproduction
= $803,977,761 food surplus from Limited Service Restaurants locations in Texas
|
|
Cause Calculations
DATA ITEM |
DATA SOURCE OR CALCULATION |
EXAMPLE |
|
|---|---|---|---|
PRE-CONSUMER SURPLUS CAUSES |
|||
Tons Overproduction |
See calculation above for Tons Overproduction |
= 20,669 tons Overproduction |
|
US Dollars Overproduction |
See calculation above for US Dollars Overproduction |
= $224,873,195 Overproduction |
|
% Unutilized Ingredient Surplus due to Cause |
Leanpath[30]
See Appendix R for causes by segment as well as proxies segments used when data was not available for a particular segment.
|
Pre-consumer food surplus causes (not including Overproduction) for the Hospitality segment in 2021 (used as a proxy for most restaurants). :
Breads & Bakery:
Cooking issues: 48.56%
Date Label Concerns: 2.16%
Equipment issues: 2.63%
Handling errors: 6.29%
Other: 4.39%
Spoiled: 25.65%
Trimmings & Byproducts: 10.32%
————————————————-
Total: 100%
Dairy & Eggs:
Cooking issues: 0.78%
Date Label Concerns: 77.93%
Equipment issues: 0.00%
Handling errors: 0.81%
Other: 0.00%
Spoiled: 20.48%
Trimmings & Byproducts: 0.00%
————————————————-
Total: 100%
Dry Goods:
Cooking issues: 9.25%
Date Label Concerns: 58.84%
Equipment issues: 0.00%
Handling errors: 7.37%
Other: 1.26%
Spoiled: 10.74%
Trimmings & Byproducts: 12.54%
————————————————-
Total: 100%
Fresh Meat & Seafood:
Cooking issues: 3.38%
Date Label Concerns: 41.69%
Equipment issues: 0.30%
Handling errors: 6.04%
Other: 0.53%
Spoiled: 20.19%
Trimmings & Byproducts: 27.88%
————————————————-
Total: 100%
Frozen:
Cooking issues: 0.00%
Date Label Concerns: 28.99%
Equipment issues: 1.31%
Handling errors: 26.19%
Other: 5.07%
Spoiled: 26.36%
Trimmings & Byproducts: 12.08%
————————————————-
Total: 100%
Prepared Foods:
Cooking issues: 6.08%
Date Label Concerns: 50.88%
Equipment issues: 3.88%
Handling errors: 4.52%
Other: 5.30%
Spoiled: 13.44%
Trimmings & Byproducts: 15.90%
————————————————-
Total: 100%
Produce:
Cooking issues: 4.25%
Date Label Concerns: 21.56%
Equipment issues: 0.13%
Handling errors: 1.90%
Other: 0.28%
Spoiled: 14.08%
Trimmings & Byproducts: 57.78%
————————————————-
Total: 100%
Ready-to-Drink Beverages:
Cooking issues: 0.00%
Date Label Concerns: 77.48%
Equipment issues: 0.00%
Handling errors: 1.04%
Other: 5.26%
Spoiled: 16.12%
Trimmings & Byproducts: 0.10%
————————————————-
Total: 100%
|
|
Tons Unutilized Ingredient Surplus Due to Cause |
= Tons Unutilized Ingredients by Food Type * % Unutilized Ingredient Surplus due to Cause |
Tons due to Cooking Issues:
= 2,796 tons surplus Breads & Bakery * 48.56% + 7,118 tons surplus Dairy & Eggs * 0.78% + 2,477 tons surplus Dry Goods * 9.25% + 3,834 tons surplus Fresh Meat & Seafood * 3.38% + 221 tons surplus Frozen * 0.00% + 1,908 tons surplus Produce * 4.25% + 0 tons surplus Ready-to-drink Beverages * 0.00%
= 2,354,891 tons
Tons due to Date Label Concerns:
= 2,796 tons surplus Breads & Bakery * 2.16% + 7,118 tons surplus Dairy & Eggs * 77.93% + 2,477 tons surplus Dry Goods * 58.84% + 3,834 tons surplus Fresh Meat & Seafood * 41.69% + 221 tons surplus Frozen * 28.99% + 1,908 tons surplus Produce * 21.56% + 0 tons surplus Ready-to-drink Beverages * 77.48%
= 41,438,374 tons
Tons due to Equipment Issues:
= 2,796 tons surplus Breads & Bakery * 2.63% + 7,118 tons surplus Dairy & Eggs * 0.00% + 2,477 tons surplus Dry Goods * 0.00% + 3,834 tons surplus Fresh Meat & Seafood * 0.30% + 221 tons surplus Frozen * 1.31% + 1,908 tons surplus Produce * 0.13% + 0 tons surplus Ready-to-drink Beverages * 0.00%
= 443,994 tons
Tons due to Handling Errors:
= 2,796 tons surplus Breads & Bakery * 6.29% + 7,118 tons surplus Dairy & Eggs * 0.81% + 2,477 tons surplus Dry Goods * 7.37% + 3,834 tons surplus Fresh Meat & Seafood * 6.04% + 221 tons surplus Frozen * 26.19% + 1,908 tons surplus Produce * 1.90% + 0 tons surplus Ready-to-drink Beverages * 1.04%
= 3,494,409 tons
Tons due to Other:
= 2,796 tons surplus Breads & Bakery * 4.39% + 7,118 tons surplus Dairy & Eggs * 0.00% + 2,477 tons surplus Dry Goods * 1.26% + 3,834 tons surplus Fresh Meat & Seafood * 0.53% + 221 tons surplus Frozen * 5.07% + 1,908 tons surplus Produce * 0.28% + 0 tons surplus Ready-to-drink Beverages * 5.26%
= 1,399,611 tons
Tons due to Spoiled:
= 2,796 tons surplus Breads & Bakery * 25.65% + 7,118 tons surplus Dairy & Eggs * 20.48% + 2,477 tons surplus Dry Goods * 10.74% + 3,834 tons surplus Fresh Meat & Seafood * 20.19% + 221 tons surplus Frozen * 26.36% + 1,908 tons surplus Produce * 14.08% + 0 tons surplus Ready-to-drink Beverages * 16.12%
= 14,631,580 tons
Tons due to Trimmings & Byproducts:
= 2,796 tons surplus Breads & Bakery * 10.32% + 7,118 tons surplus Dairy & Eggs * 0.00% + 2,477 tons surplus Dry Goods * 12.54% + 3,834 tons surplus Fresh Meat & Seafood * 27.88% + 221 tons surplus Frozen * 12.08% + 1,908 tons surplus Produce * 57.78% + 0 tons surplus Ready-to-drink Beverages * 0.10%
= 12,987,179 tons
|
|
US Dollars Unutilized Ingredient Surplus Due to Cause |
= US Dollars Unutilized Ingredients by Food Type * % Unutilized Ingredient Surplus due to Cause |
US Dollars due to Cooking Issues:
= $2,796 surplus Breads & Bakery * 48.56% + $13,097,248 surplus Dairy & Eggs * 0.78% + $9,550,096 surplus Dry Goods * 9.25% + $24,030,213 surplus Fresh Meat & Seafood * 3.38% + $617,322 surplus Frozen * 0.00% + $6,247,816 surplus Produce * 4.25% + $0 surplus Ready-to-drink Beverages * 0.00%
= $2,354,891
US Dollars due to Date Label Concerns:
= $13,534,229 surplus Breads & Bakery * 2.16% + $13,097,248 surplus Dairy & Eggs * 77.93% + $9,550,096 surplus Dry Goods * 58.84% + $24,030,213 surplus Fresh Meat & Seafood * 41.69% + $617,322 surplus Frozen * 28.99% + $6,247,816 surplus Produce * 21.56% + $0 surplus Ready-to-drink Beverages * 77.48%
= $41,438,374
US Dollars due to Equipment Issues:
= $13,534,229 surplus Breads & Bakery * 2.63% + $13,097,248 surplus Dairy & Eggs * 0.00% + $9,550,096 surplus Dry Goods * 0.00% + $24,030,213 surplus Fresh Meat & Seafood * 0.30% + $617,322 surplus Frozen * 1.31% + $6,247,816 surplus Produce * 0.13% + $0 surplus Ready-to-drink Beverages * 0.00%
= $443,994
US Dollars due to Handling Errors:
= $13,534,229 surplus Breads & Bakery * 6.29% + $13,097,248 surplus Dairy & Eggs * 0.81% + $9,550,096 surplus Dry Goods * 7.37% + $24,030,213 surplus Fresh Meat & Seafood * 6.04% + $617,322 surplus Frozen * 26.19% + $6,247,816 surplus Produce * 1.90% + $0 surplus Ready-to-drink Beverages * 1.04%
= $3,494,409
US Dollars due to Other:
= $13,534,229 surplus Breads & Bakery * 4.39% + $13,097,248 surplus Dairy & Eggs * 0.00% + $9,550,096 surplus Dry Goods * 1.26% + $24,030,213 surplus Fresh Meat & Seafood * 0.53% + $617,322 surplus Frozen * 5.07% + $6,247,816 surplus Produce * 0.28% + $0 surplus Ready-to-drink Beverages * 5.26%
= $1,399,611
US Dollars due to Spoiled:
= $13,534,229 surplus Breads & Bakery * 25.65% + $13,097,248 surplus Dairy & Eggs * 20.48% + $9,550,096 surplus Dry Goods * 10.74% + $24,030,213 surplus Fresh Meat & Seafood * 20.19% + $617,322 surplus Frozen * 26.36% + $6,247,816 surplus Produce * 14.08% + $0 surplus Ready-to-drink Beverages * 16.12%
= $14,631,580
US Dollars due to Trimmings & Byproducts:
= $13,534,229 surplus Breads & Bakery * 10.32% + $13,097,248 surplus Dairy & Eggs * 0.00% + $9,550,096 surplus Dry Goods * 12.54% + $24,030,213 surplus Fresh Meat & Seafood * 27.88% + $617,322 surplus Frozen * 12.08% + $6,247,816 surplus Produce * 57.78% + $0 surplus Ready-to-drink Beverages * 0.10%
= $12,987,179
|
|
PLATE WASTE AND CATERING OVERPRODUCTION |
|||
Tons Plate Waste |
See calculation above for Tons Plate Waste |
= 22,554 tons plate waste |
|
US Dollars Plate Waste |
See calculation above for US Dollars Plate Waste |
= $245,376,513 plate waste |
|
Tons Catering Overproduction |
See calculation above for Tons Catering Overproduction |
= 23,620 tons catering overproduction |
|
US Dollars Catering Overproduction |
See calculation above for US Dollars Catering Overproduction |
= $256,978,084 catering overproduction |
|
Destination Calculations
DATA ITEM |
DATA SOURCE OR CALCULATION |
EXAMPLE |
|---|---|---|
Destination Breakdown of PreConsumer Food Surplus |
Food Waste Reduction Alliance (FWRA) Survey[14]
Note: ReFED used Leanpath[30] data rather than FWRA survey data to quantify the breakdown of preconsumer surplus for states that have organic waste recycling laws (California, Connecticut, Massachusetts, Oregon, Vermont, Washington). See Appendix S (LINK!) for more information.
|
donations: __foodservice_example_preconsumer_pct_donations__%
Animal feed: 0.01%
Anaerobic Digestion: __foodservice_example_preconsumer_pct_ad__%
Compost: __foodservice_example_preconsumer_pct_composting__%
Land Application: 0.00%
Sewer: 0.00%
Dumping: __foodservice_example_preconsumer_pct_dumping__%
Trash: 98.72%
————————————————
Total: 100%
Note: ReFED excluded industrial uses (biomaterials/processing) data from the FWRA surveys, because most of this is spent cooking oil rather than preconsumer surplus.
|
% of Trash that is landfill vs incineration in Texas (Biocycle/Columbia University Survey[8]) (See Appendix Z) |
% of Trash that is landfill = __foodservice_example_pct_trash_landfill__%
% of Trash that is incineration = __foodservice_example_pct_trash_incineration__%
|
|
Breaking “Trash” into Landfill vs Incineration:
% landfill = % Trash * % of Trash that is landfill
% incineration = % Trash * % of Trash that is incineration
|
% landfill:
= 98.72% * __foodservice_example_pct_trash_landfill__%
= __foodservice_example_pct_preconsumer_landfill__%
% incineration:
= 98.72% * __foodservice_example_pct_trash_incineration__%
= __foodservice_example_pct_preconsumer_incineration__%
|
|
Destination Breakdown of Plate Waste |
ReFED assumed that plate waste was sent to “Trash” in all states, except states that have organic waste recycling laws. For those states, Leanpath[30] plate waste destinations data was used instead. See Appendix T for more information. |
Assumed 100% Trash for plate waste in Texas |
% of Trash that is landfill vs incineration in Texas (Biocycle/Columbia University Survey[8]) (See Appendix Z) |
% of Trash that is landfill = __foodservice_example_pct_trash_landfill__%
% of Trash that is incineration = __foodservice_example_pct_trash_incineration__%
|
|
Breaking “Trash” into Landfill vs Incineration:
% landfill = % Trash * % of Trash that is landfill
% incineration = % Trash * % of Trash that is incineration
|
% landfill = 100% * __foodservice_example_pct_trash_landfill__% = __foodservice_example_pct_platewaste_landfill__%
% incineration = 0% * __foodservice_example_pct_trash_incineration__% = __foodservice_example_pct_platewaste_incineration__%
|
|
Destination Breakdown of Catering Overproduction |
ReFED assumed that catering overproduction was sent to “Trash” in all states, except states that have organic waste recycling laws. For those states, Leanpath[30] plate waste destinations data was used instead. See Appendix U for more information. |
donations: __foodservice_example_catering_pct_donations__%
Animal feed: 0.00%
Anaerobic Digestion: __foodservice_example_catering_pct_ad__%
Compost: __foodservice_example_catering_pct_composting__%
Industrial uses: __foodservice_example_catering_pct_industrial__%
Land Application: 0.00%
Sewer: 0.00%
Dumping: __foodservice_example_catering_pct_dumping__%
Trash: 100.00%
————————————————
Total: 100%
|
% of Trash that is landfill vs incineration in Texas (Biocycle/Columbia University Survey[8]) (See Appendix Z) |
% of Trash that is landfill = __foodservice_example_pct_trash_landfill__%
% of Trash that is incineration = __foodservice_example_pct_trash_incineration__%
|
|
Breaking “Trash” into Landfill vs Incineration:
% landfill = % Trash * % of Trash that is landfill
% incineration = % Trash * % of Trash that is incineration
|
% landfill = 100.00% * __foodservice_example_pct_trash_landfill__% = __foodservice_example_pct_catering_overproduction_landfill__%
% incineration = 100.00% * __foodservice_example_pct_trash_incineration__% = __foodservice_example_pct_catering_overproduction_incineration__%
|
|
Tons donations |
= Tons Pre-Consumer Surplus (incl or exlc overproduction??) * % Donations for Pre-Consumer Surplus + Total Tons Plate Waste * % Donations for Plate Waste + Tons Catering Overproduction * % Donations for Catering Overproduction |
= 22,346 tons * __foodservice_example_preconsumer_pct_donations__% + 22,554 tons * 0% + 23,620 tons * __foodservice_example_catering_pct_donations__%
= __foodservice_example_tons_donations__ tons
|
Tons Animal Feed |
= Tons Pre-Consumer Surplus * % Animal Feed for Pre-Consumer Surplus + Total Tons Plate Waste * % Animal Feed for Plate Waste + Tons Catering Overproduction * % Animal Feed for Catering Overproduction |
= 22,346 tons * 0.01% + 22,554 tons * 0% + 23,620 tons * 0.00%
= 4 tons
|
Tons Industrial uses |
= Tons Pre-Consumer Surplus * % Industrial uses for Pre-Consumer Surplus + Total Tons Plate Waste * % Industrial uses for Plate Waste + Tons Catering Overproduction * % Industrial uses for Catering Overproduction |
= 22,346 tons * __foodservice_example_preconsumer_pct_industrial__% + 22,554 tons * 0% + 23,620 tons * __foodservice_example_catering_pct_industrial__%
= __foodservice_example_tons_industrial__ tons
|
Tons Anaerobic Digestion |
= Tons Pre-Consumer Surplus * % Anaerobic Digestion for Pre-Consumer Surplus + Total Tons Plate Waste * % Anaerobic Digestion for Plate Waste + Tons Catering Overproduction * % Anaerobic Digestion for Catering Overproduction |
= 22,346 tons * __foodservice_example_preconsumer_pct_ad__% + 22,554 tons * 0% + 23,620 tons * __foodservice_example_catering_pct_ad__%
= __foodservice_example_tons_ad__ tons
|
Tons composting |
= Tons Pre-Consumer Surplus * % composting for Pre-Consumer Surplus + Total Tons Plate Waste * % composting for Plate Waste + Tons Catering Overproduction * % composting for Catering Overproduction |
= 22,346 tons * __foodservice_example_preconsumer_pct_composting__% + 22,554 tons * 0% + 23,620 tons * __foodservice_example_catering_pct_composting__%
= __foodservice_example_tons_composting__ tons
|
Tons Land Application |
= Tons Pre-Consumer Surplus * % Land Application for Pre-Consumer Surplus + Total Tons Plate Waste * % Land Application for Plate Waste + Tons Catering Overproduction * % Land Application for Catering Overproduction |
= 22,346 tons * 0.00% + 22,554 tons * 0% + 23,620 tons * 0.00%
= 0 tons
|
Tons Sewer |
= Tons Pre-Consumer Surplus * % Sewer for Pre-Consumer Surplus + Total Tons Plate Waste * % Sewer for Plate Waste + Tons Catering Overproduction * % Sewer for Catering Overproduction |
= 22,346 tons * 0.00% + 22,554 tons * 0% + 23,620 tons * 0.00%
= 0 tons
|
Tons Dumping |
= Tons Pre-Consumer Surplus * % Dumping for Pre-Consumer Surplus + Total Tons Plate Waste * % Dumping for Plate Waste + Tons Catering Overproduction * % Dumping for Catering Overproduction |
= 22,346 tons * __foodservice_example_preconsumer_pct_dumping__% + 22,554 tons * 0% + 23,620 tons * __foodservice_example_catering_pct_dumping__%
= __foodservice_example_tons_dumping__ tons
|
Tons landfill |
= Tons Pre-Consumer Surplus * % landfill for Pre-Consumer Surplus + Total Tons Plate Waste * % landfill for Plate Waste + Tons Catering Overproduction * % landfill for Catering Overproduction |
= 22,346 tons * __foodservice_example_pct_preconsumer_landfill__% + 22,554 tons * __foodservice_example_pct_platewaste_landfill__% + 23,620 tons * __foodservice_example_pct_catering_overproduction_landfill__%
= __foodservice_example_tons_landfill__ tons
|
Tons Incineration |
= Tons Pre-Consumer Surplus * % Incineration for Pre-Consumer Surplus + Total Tons Plate Waste * % Incineration for Plate Waste + Tons Catering Overproduction * % Incineration for Catering Overproduction |
= 22,346 tons * __foodservice_example_pct_preconsumer_incineration__% + 22,554 tons * __foodservice_example_pct_platewaste_incineration__% + 23,620 tons * __foodservice_example_pct_catering_overproduction_incineration__%
= __foodservice_example_tons_incineration__ tons
|
US Dollars donations |
= US Dollars Pre-Consumer Surplus * % Donations for Pre-Consumer Surplus + Total US Dollars Plate Waste * % Donations for Plate Waste + US Dollars Catering Overproduction * % Donations for Catering Overproduction |
= $76,749,967 * __foodservice_example_preconsumer_pct_donations__% + $245,376,513 * 0% + $256,978,084 * __foodservice_example_catering_pct_donations__%
= $__foodservice_example_dollars_donations__
|
US Dollars Animal Feed |
= US Dollars Pre-Consumer Surplus * % Animal Feed for Pre-Consumer Surplus + Total US Dollars Plate Waste * % Animal Feed for Plate Waste + US Dollars Catering Overproduction * % Animal Feed for Catering Overproduction |
= $76,749,967 * 0.01% + $245,376,513 * 0% + $256,978,084 * 0.00%
= $33,178
|
US Dollars Industrial uses |
= US Dollars Pre-Consumer Surplus * % Industrial uses for Pre-Consumer Surplus + Total US Dollars Plate Waste * % Industrial uses for Plate Waste + US Dollars Catering Overproduction * % Industrial uses for Catering Overproduction |
= $76,749,967 * __foodservice_example_preconsumer_pct_industrial__% + $245,376,513 * 0% + $256,978,084 * __foodservice_example_catering_pct_industrial__%
= $__foodservice_example_dollars_industrial__
|
US Dollars Anaerobic Digestion |
= US Dollars Pre-Consumer Surplus * % Anaerobic Digestion for Pre-Consumer Surplus + Total US Dollars Plate Waste * % Anaerobic Digestion for Plate Waste + US Dollars Catering Overproduction * % Anaerobic Digestion for Catering Overproduction |
= $76,749,967 * __foodservice_example_preconsumer_pct_ad__% + $245,376,513 * 0% + $256,978,084 * __foodservice_example_catering_pct_ad__%
= $__foodservice_example_dollars_ad__
|
US Dollars composting |
= US Dollars Pre-Consumer Surplus * % composting for Pre-Consumer Surplus + Total US Dollars Plate Waste * % composting for Plate Waste + US Dollars Catering Overproduction * % composting for Catering Overproduction |
= $76,749,967 * __foodservice_example_preconsumer_pct_composting__% + $245,376,513 * 0% + $256,978,084 * __foodservice_example_catering_pct_composting__%
= $__foodservice_example_dollars_composting__
|
US Dollars Land Application |
= US Dollars Pre-Consumer Surplus * % Land Application for Pre-Consumer Surplus + Total US Dollars Plate Waste * % Land Application for Plate Waste + US Dollars Catering Overproduction * % Land Application for Catering Overproduction |
= $76,749,967 * 0.00% + $245,376,513 * 0% + $256,978,084 * 0.00%
= $0
|
US Dollars Sewer |
= US Dollars Pre-Consumer Surplus * % Sewer for Pre-Consumer Surplus + Total US Dollars Plate Waste * % Sewer for Plate Waste + US Dollars Catering Overproduction * % Sewer for Catering Overproduction |
= $76,749,967 * 0.00% + $245,376,513 * 0% + $256,978,084 * 0.00%
= $0
|
US Dollars Dumping |
= US Dollars Pre-Consumer Surplus * % Dumping for Pre-Consumer Surplus + Total US Dollars Plate Waste * % Dumping for Plate Waste + US Dollars Catering Overproduction * % Dumping for Catering Overproduction |
= $76,749,967 * __foodservice_example_preconsumer_pct_dumping__% + $245,376,513 * 0% + $256,978,084 * __foodservice_example_catering_pct_dumping__%
= $__foodservice_example_dollars_dumping__
|
US Dollars landfill |
= US Dollars Pre-Consumer Surplus * % landfill for Pre-Consumer Surplus + Total US Dollars Plate Waste * % landfill for Plate Waste + US Dollars Catering Overproduction * % landfill for Catering Overproduction |
= $76,749,967 * __foodservice_example_pct_preconsumer_landfill__% + $245,376,513 * 100% + $256,978,084 * __foodservice_example_pct_catering_overproduction_landfill__%
= $__foodservice_example_dollars_landfill__
|
US Dollars Incineration |
= US Dollars Pre-Consumer Surplus * % Incineration for Pre-Consumer Surplus + Total US Dollars Plate Waste * % Incineration for Plate Waste + US Dollars Catering Overproduction * % Incineration for Catering Overproduction |
= $76,749,967 * __foodservice_example_pct_preconsumer_incineration__% + $245,376,513 * 0% + $256,978,084 * __foodservice_example_pct_catering_overproduction_incineration__%
= $__foodservice_example_dollars_incineration__
|
Data Sources and Limitations
National Foodservice Purchases and Sales
State Restaurant Locations and Employee Counts for Non-Restaurant Segments
Raw data and documentation:
Restaurant Locations: This contains confidential data from Technomic and cannot be shared.
Employee Counts for Non-Restaurant: https://refed-roadmap.s3-us-west-2.amazonaws.com/public_documentation/Documentation_Foodservice_EmployeeCounts.xlsx
For limited service restaurants, full service restaurants, and bars & taverns, ReFED allocated national sales down to the state level using the Technomic state-level locations data for the Top 500 restaurants[44]. A limitation of this approach is that sales is not always proportional to the number of locations.
Wholesale Price per Lb
Pre-Consumer Surplus Rates
Leanpath is a technology company that helps foodservice companies track, weigh and analyze the amount of food that is wasted in commercial kitchens. Leanpath customers indicate the reason the food was not used, where it will be sent (e.g., composting, landfill, etc.), and the food type of the disposed food when using Leanpath’s software system. Based on the data in their system across multiple clients, Leanpath estimates that on average 4.2% of food purchases are not utilized in commercial foodservice kitchens[30].
Food Type Breakdown
Distribution Channels (Dine in vs Takeout vs Catering)
Plate Waste Rates
Catering Overproduction Rates
Pre-Consumer Surplus Causes
Pre-Consumer Surplus Destinations
For most states, ReFED used data from the 2016 Food Waste Reduction Alliance (FWRA) survey[14] of restaurants in which 28 restaurant companies responded (11.8% of U.S. market share based on sales) to estimate the destination breakdown of pre-consumer surplus. Data on industrial uses (or biomaterials/processing) was excluded because most of this is spent cooking oil rather than pre-consumer surplus. Since this data indicated that 94% of pre-consumer surplus is landfill, which is not the case in states that have organics recycling laws, ReFED instead used data from Leanpath[30] to estimate the pre-consumer surplus destinations for these states (California, Connecticut, Massachusetts, Oregon, Vermont, and Washington). ReFED did not use the Leanpath data for other states to avoid selection bias as Leanpath clients may be more likely to compost food scraps than the average foodservice business.
Plate Waste Destinations
Raw data and documentation: - https://refed-roadmap.s3-us-west-2.amazonaws.com/public_documentation/Documentation_Foodservice_CateringPlateWasteDestinations.xlsx - https://refed-roadmap.s3-us-west-2.amazonaws.com/public_documentation/Documentation_Foodservice_OnsitePlateWasteDestinations.xlsx
ReFED assumed that plate waste was sent to “Trash” in all states, except states that have organics recycling laws. For these states (California, Connecticut, Massachusetts, Oregon, Vermont, and Washington), Leanpath plate waste destinations data was used instead[30]. ReFED did not use the Leanpath data for other states to avoid selection bias as Leanpath clients may be more likely to compost food scraps than the average foodservice business.
Catering Overproduction Destinations
ReFED assumed that catering overproduction was sent to “Trash” in all states, except states that have organic waste recycling laws. For states with organics recycling laws (California, Connecticut, Massachusetts, Oregon, Vermont, and Washington), Leanpath catering overproduction destinations data was used instead[30]. ReFED did not use the Leanpath data for other states to avoid selection bias as Leanpath clients may be more likely to compost food scraps than the average foodservice business.
Data Quality Evaluation
This quality assessment is meant to evaluate the quality of how each data source was used by ReFED to estimate food loss and waste. It is not meant to rate the quality of the study itself. A high quality study used by ReFED beyond the study’s intended purposes could result in a low data quality score. See Appendix AA for more information about the ReFED Data Quality Rubric.
Table 16. Data Quality Evaluation for Food Waste Monitor Foodservice Sector
DATA |
SOURCE |
DATA QUALITY SCORE |
||||||
|---|---|---|---|---|---|---|---|---|
CREDIBILITY |
UPDATE FREQUENCY |
COVERAGE |
FOOD TYPE |
GEOGRAPHY |
SCORE |
WEIGHT |
||
FOODSERVICE SURPLUS DATA |
||||||||
National Purchases from Suppliers |
Technomic Ignite Platform |
4 |
5 |
5 |
1 |
3 |
Medium 18/5 = 3.6 |
10% |
National US Dollars Sold |
Technomic Ignite Platform |
4 |
5 |
5 |
1 |
3 |
Medium 18/5 = 3.6 |
8% |
State Locations for Top 500 Restaurants |
Technomic Ignite Platform |
4 |
5 |
5 |
1 |
5 |
High 20/5 = 4.0 |
8% |
State Employee Counts for Non-Restaurant Segments |
U.S. Bureau of Labor Statistics Employee Levels |
5 |
5 |
5 |
1 |
5 |
High 21/5 = 4.2 |
8% |
Food Type Breakdown |
Technomic Ignite Platform Menu Data |
2 |
1 |
1 |
5 |
3 |
Low 12/5 = 2.4 |
8% |
Wholesale Price per Lb |
ReFED Calculations |
2 |
5 |
1 |
5 |
3 |
Medium 16/5 = 3.2 |
8% |
Pre-Consumer Surplus Rate |
Leanpath |
4 |
1 |
1 |
1 |
3 |
Low 10/5 = 2.0 |
3% |
Distribution Channels (Dine in vs Takeout vs Catering) |
Technomic Ignite Platform |
4 |
1 |
5 |
3 |
3 |
Medium 16/5 = 3.2 |
10% |
Plate Waste Rates |
Plate Waste Studies |
__foodservice_surplus_platewaste_rates_credibility__ |
__foodservice_surplus_platewaste_rates_update_frequency__ |
__foodservice_surplus_platewaste_rates_coverage__ |
__foodservice_surplus_platewaste_rates_food_type__ |
__foodservice_surplus_platewaste_rates_geography__ |
__foodservice_surplus_platewaste_rates_score_text__ |
__foodservice_surplus_platewaste_rates_weight_text__ |
% Catering Overproduction |
Expert Interviews |
1 |
1 |
1 |
2 |
1 |
Very Low 6/5 = 1.2 |
2% |
3.6 * 10% + 3.6 * 8% + 4.0 * 8% + 4.2 * 8% + 2.4 * 8% + 3.2 * 8% + 2.0 * 3% + 3.2 * 10% + 2.2 * 35% + 1.2 * 2% = 2.93 |
Low |
|||||||
FOODSERVICE CAUSES DATA |
||||||||
% Pre-Consumer Surplus due to Cause |
Leanpath |
4 |
5 |
1 |
5 |
3 |
Medium 18/5 = 3.6 |
6% |
Distribution Channels (Dine in vs Takeout vs Catering) |
Technomic Ignite Platform |
4 |
5 |
5 |
5 |
3 |
High 22/5 = 4.4 |
20% |
Plate Waste Rates |
Plate Waste Studies |
__foodservice_causes_platewaste_rates_credibility__ |
__foodservice_causes_platewaste_rates_update_frequency__ |
__foodservice_causes_platewaste_rates_coverage__ |
__foodservice_causes_platewaste_rates_food_type__ |
__foodservice_causes_platewaste_rates_geography__ |
__foodservice_causes_platewaste_rates_score_text__ |
__foodservice_causes_platewaste_rates_weight_text__ |
% Catering Overproduction |
Expert Interviews |
1 |
1 |
1 |
2 |
1 |
Very Low 6/5 = 1.2 |
4% |
3.6 * 6% + 4.4 * 20% + 2.0 * 70% + 1.2 * 4% = 2.54 |
Low |
|||||||
FOODSERVICE DESTINATIONS DATA |
||||||||
% Destination Breakdown for Pre-Consumer Surplus |
FWRA Surveys, Leanpath |
3 |
1 |
1 |
1 |
2 |
Very Low 8/5 = 1.6 |
15% |
% Destination Breakdown for Plate Waste |
Leanpath, ReFED Assumptions |
__foodservice_destinations_platewaste_destinations_credibility__ |
__foodservice_destinations_platewaste_destinations_update_frequency__ |
__foodservice_destinations_platewaste_destinations_coverage__ |
__foodservice_destinations_platewaste_destinations_food_type__ |
__foodservice_destinations_platewaste_destinations_geography__ |
__foodservice_destinations_platewaste_destinations_score_text__ |
__foodservice_destinations_platewaste_destinations_weight_text__ |
% Destination Breakdown for Catering Overproduction |
Leanpath, ReFED Assumptions |
4 |
5 |
1 |
5 |
2 |
Medium 17/5 = 3.4 |
10% |
% of Trash landfill vs incineration |
Biocycle/Columbia University Survey |
5 |
1 |
5 |
1 |
5 |
Medium 17/5 = 3.4 |
10% |
1.6 * 15% + 3.4 * 65% + 3.4 * 10% + 3.4 * 10% = 3.13 |
Medium |
|||||||