Retail Methodology
Scope Boundary
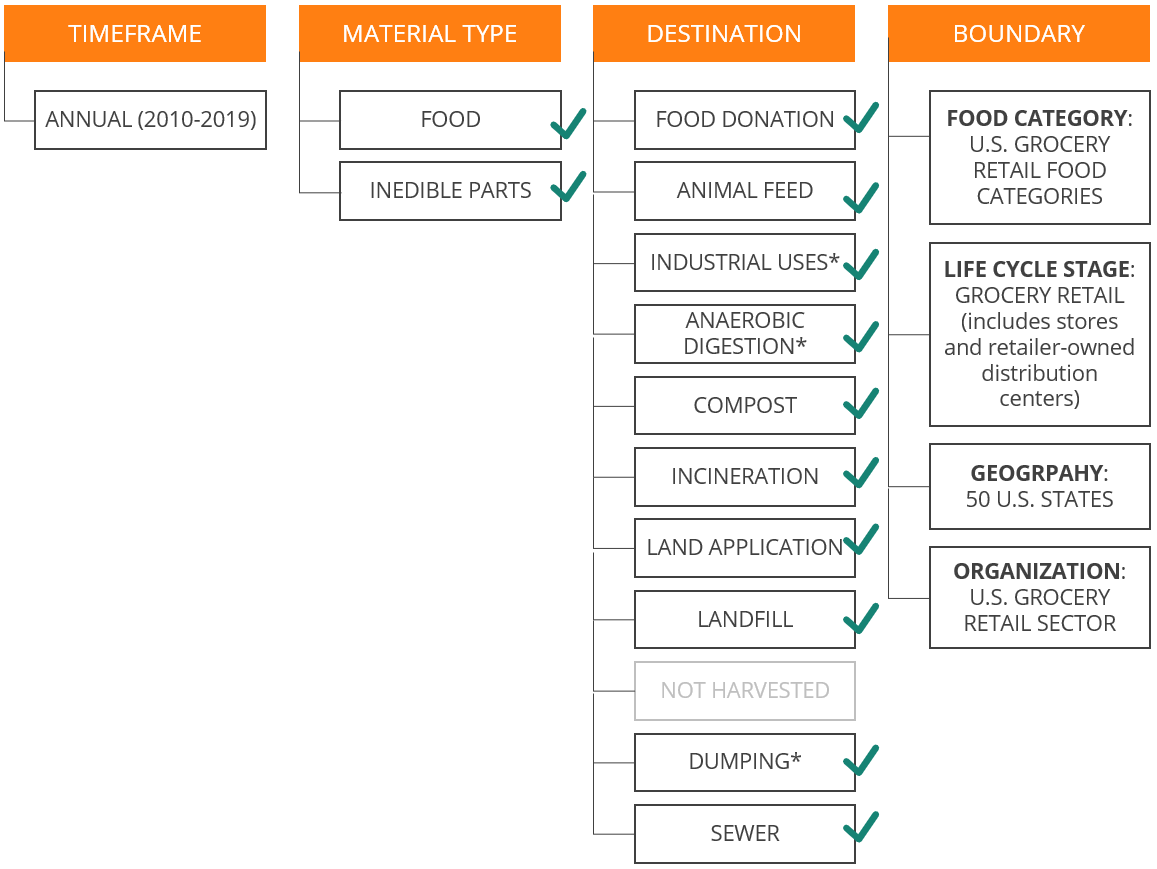
This diagram communicates the scope boundary as aligned with the Food Loss and Waste Accounting and Reporting Standard[17]. Note that ReFED’s analysis also includes food sent to donations, although donations are not considered a destination within the Standard.
- NOTES
“Food Donation” has been added as a Destination
“Biomaterial Processing is referred to as “Industrial Uses” in our model
“Anaerobic digestion” is referred to as “Anaerobic digestion” in our model
“Controlled Combustion” is referred to as “Incineration” in our model
“Refuse/discards” is referred to as “Dumping” in our model
Calculations
Unsold Food Calculations
In ReFED’s data model, the following calculations are repeated for every state, year, and grocery retail food category before any aggregation is done.
DATA ITEM |
DATA SOURCE OR CALCULATION |
EXAMPLE |
|---|---|---|
US Dollars Sold |
Nielsen Retail Point-of Sale (POS) Data[38] |
$ 43,334,294 Tomatoes sold by grocery retailers in Arkansas in 2021 |
Tons Sold |
Nielsen Retail Point-of Sale (POS) Data[38] |
9,971 tons Tomatoes sold by grocery retailers in Arkansas in 2021 |
Unsold Food Rate |
According to USDA LAFA study, 5.96% by weight of fresh Tomatoes goes unsold |
|
Tons Purchased by Retailers |
= Tons Sold / ( 100% - Unsold Food Rate ) |
= 9,971 tons sold / ( 100% - 5.96% )
= 10,603 tons purchased by retailers
|
US Dollars Purchased by Retailers |
= US Dollars Sold / ( 100% - Unsold Food Rate) |
= $43,334,294 sold / ( 100% - 5.96% )
= $46,082,664 retail value purchased from suppliers
|
Tons Unsold |
= Tons Purchased by Retailers - Tons Sold |
= 10,603 tons purchased - 9,971 tons sold
= 632 tons unsold
|
US Dollars Unsold |
= US Dollars Purchased - US Dollars Sold |
= $46,082,664 retail value purchased - $43,334,294 sold
= $2,748,370 unsold
|
Cause Calculations
DATA ITEM |
DATA SOURCE OR CALCULATION |
EXAMPLE |
|---|---|---|
% Unsold Food due to Cause |
Expert Interviews Data[11]
See Appendix M
|
% Breakdown of retail unsold food causes for Produce:
Date label concerns: 64.48%
Equipment issues: 1.41%
Food safety recall: 0.05%
Handling errors: 5.09%
Spoiled: 27.47%
Theft: 1.50%
—————————–
Total: 100%
|
Tons Unsold due to Cause |
= Tons Unsold * % Unsold Food due to Cause |
Date label concerns:
= 632 tons unsold Tomatoes * 64.48%
= 407 tons
Equipment issues:
= 632 tons unsold Tomatoes * 1.41%
= 8 tons
Food safety recall:
= 632 tons unsold Tomatoes * 0.05%
= 0 tons
Handling errors:
= 632 tons unsold Tomatoes * 5.09%
= 32 tons
Spoiled:
= 632 tons unsold Tomatoes * 27.47%
= 173 tons
Theft:
= 632 tons unsold Tomatoes * 1.50%
= 9 tons
|
US Dollars Unsold due to Cause |
= US Dollars Unsold * % Unsold Food due to Cause |
Date label concerns:
= $2,748,370 unsold Tomatoes * 64.48%
= $1,772,066
Equipment issues:
= $2,748,370 unsold Tomatoes * 1.41%
= $38,806
Food safety recall:
= $2,748,370 unsold Tomatoes * 0.05%
= $1,374
Handling errors:
= $2,748,370 unsold Tomatoes * 5.09%
= $139,837
Spoiled:
= $2,748,370 unsold Tomatoes * 27.47%
= $755,059
Theft:
= $2,748,370 unsold Tomatoes * 1.50%
= $41,225
|
Destination Calculations
DATA ITEM |
DATA SOURCE OR CALCULATION |
EXAMPLE |
|---|---|---|
Destination Breakdown of Retail Surplus Food |
FWRA Surveys[25] |
According to the FWRA Surveys, this was the destination breakdown of retail surplus (See Appendix N):
% Donations: __retail_example_percent_donations__%
% Animal Feed: 18.52%
% Industrial uses: __retail_example_percent_industrial_uses__%
% Co/anaerobic Digestion: __retail_example_percent_anaerobic_digestion__%
% Composting: __retail_example_percent_composting__%
% Land Application: 1.17%
% Sewer: 0.00%
% Trash: 33.83%
% Refuse / discards: __retail_example_percent_dumping__%
————————————————
Total: 100%
|
% of Trash that is landfill vs incineration in Arkansas (Biocycle/Columbia University Survey[8]) (See Appendix Z) |
% of Trash that is landfill = 100.00%
% of Trash that is incineration = 0.00%
|
|
Breaking “Trash” into Landfill vs Incineration:
% landfill = % Trash * % of Trash that is landfill
% incineration = % Trash * % of Trash that is incineration
|
% landfill:
= 33.83% * 100.00%
= __retail_example_percent_landfill__%
% incineration:
= 33.83% * 0.00%
= __retail_example_percent_incineration__%
|
|
Tons donations |
= Tons Surplus * % donations |
= 632 tons Tomatoes surplus * __retail_example_percent_donations__% donations
= __retail_example_tons_donations__ tons Tomatoes donations
|
Tons Animal Feed |
= Tons Surplus * % Animal Feed |
= 632 tons Tomatoes surplus * 18.52% animal feed
= 117 tons Tomatoes sent to animal feed
|
Tons Industrial uses |
= Tons Surplus * % Industrial uses |
= 632 tons Tomatoes surplus * __retail_example_percent_industrial_uses__% industrial uses
= __retail_example_tons_industrial_uses__ tons Tomatoes sent to industrial uses
|
Tons Anaerobic digestion |
= Tons Surplus * % Anaerobic digestion |
= 632 tons Tomatoes surplus * __retail_example_percent_anaerobic_digestion__% anaerobic digestion
= __retail_example_tons_anaerobic_digestion__ tons Tomatoes sent to co/anaerobic digestion
|
Tons composting |
= Tons Surplus * % composting |
= 632 tons Tomatoes surplus * __retail_example_percent_composting__% composting
= __retail_example_percent_composting__ tons Tomatoes composting
|
Tons Land application |
= Tons Surplus * % Land applications |
= 632 tons Tomatoes surplus * 1.17% land application
= 7 tons Tomatoes sent to land application
|
Tons Sewer |
= Tons Surplus * % Sewer |
= 632 tons Tomatoes surplus * 0.00% disposed down the drain
= 0 tons Tomatoes disposed via sewer
|
Tons landfill |
= Tons Surplus * % landfill |
= 632 tons Tomatoes surplus * __retail_example_percent_landfill__% landfill
= __retail_example_tons_landfill__ tons _Tomatoes landfill
|
Tons Incineration |
= Tons Surplus * % Incineration |
= 632 tons Tomatoes surplus * __retail_example_percent_incineration__% incineration
= __retail_example_tons_incineration__ tons Tomatoes incineration
|
US Dollars donations |
= US Dollars Surplus * % donations |
= $2,748,370 US dollars Tomatoes surplus * __retail_example_percent_donations__% donations
= $__retail_example_us_dollars_donations__ US dollars Tomatoes donations
|
US Dollars Animal Feed |
= US Dollars Surplus * % Animal Feed |
= $2,748,370 US dollars Tomatoes surplus * 18.52% animal feed
= $509,017 US dollars Tomatoes sent to animal feed
|
US Dollars Industrial uses |
= US Dollars Surplus * % Industrial uses |
= $2,748,370 US dollars Tomatoes surplus * __retail_example_percent_industrial_uses__% industrial uses
= $__retail_example_us_dollars_industrial_uses__ US dollars Tomatoes sent to industrial uses
|
US Dollars Anaerobic digestion |
= US Dollars Surplus * % Anaerobic digestion |
= $2,748,370 US dollars Tomatoes surplus * __retail_example_percent_anaerobic_digestion__% co/anaerobic digestion
= $__retail_example_us_dollars_anaerobic_digestion__ US dollars Tomatoes sent to anaerobic digestion
|
US Dollars composting |
= US Dollars Surplus * % composting |
= $2,748,370 US dollars Tomatoes surplus * __retail_example_percent_composting__% composting
= $__retail_example_us_dollars_composting__ US dollars Tomatoes composting
|
US Dollars Land application |
= US Dollars Surplus * % Land application |
= $2,748,370 US dollars Tomatoes surplus * 1.17% land application
= $32,115 US dollars Tomatoes sent to land application
|
US Dollars Sewer |
= US Dollars Surplus * % Sewer |
= $2,748,370 US dollars Tomatoes surplus * 0.00% disposed down the drain
= $0 US dollars Tomatoes disposed via sewer
|
US Dollars landfill |
= US Dollars Surplus * % landfill |
= $2,748,370 US dollars Tomatoes surplus * __retail_example_percent_landfill__% landfill
= $__retail_example_us_dollars_landfill__ US dollars Tomatoes landfill
|
US Dollars Incineration |
= US Dollars Surplus * % Incineration |
= $2,748,370 US dollars Tomatoes surplus * __retail_example_percent_incineration__% incineration
= $__retail_example_us_dollars_incineration__ US dollars Tomatoes incineration
|
Data Sources and Limitations
Retail Value and Tons Sold
Nielsen data represents over 85% coverage of grocery retail sales in the U.S. Each year top U.S. grocery retailers report item level point-of-sale sales data to Nielsen[38], including information about each item such as the grocery chain where it was sold, the brand name of the product, the food classification (department, category, subcategory), the weight of food and packaging, and many other attributes. ReFED used this data to quantify the retail value and weight of food sold by grocery retailers in the U.S. by year, state, and food type. For more information about the weight data, see the U.S. Grocery Retail Dollar-to-Weight Conversion Factors report[40].
Nielsen provided point-of-sale data for the years 2016-2019. In order to estimate values for the missing years 2010-2015 each subcategory was extrapolated using category-level average year-over-year linear growth rates for both sales value and sales weight. Due to the high granularity of the categories, there were some cases where the growth rates were either extremely high or extremely low. To avoid unrealistic growth estimations over time within these outlier categories, department-level growth rates were used instead if a category had a growth rate ±15%. These outlier categories represent 0.5% of total sales.
Unsold Food Rates
In 2016, USDA released a study using data from 2012 that quantified the percentage by weight of grocery retail supplier purchases that are not sold to customers[5]. Five individual retailers contributed supplier purchase data for the study and these numbers were compared to customer sales data. The data covered 45 states and 2,900 locations. See Appendix K for a list of unsold food rates from this study. These numbers are very credible and valuable for estimating retail food surplus in the U.S. The only limitations of using this dataset for this purpose are that the data is from 2012, and it does not cover a significant portion of items sold at grocery stores (e.g. complex products like boxed dinners, frozen meals, bakery items, etc.). ReFED used the 2012 unsold food rates for all years 2010-2019 when it was available for specific categories, so any changes in these rates over time are not reflected in the results.
Unsold Food Causes
ReFED was not able to identify any publicly available data sources that quantify the causes of unsold food for grocery retailers in the U.S. As a placeholder until further research can be done, ReFED developed estimates using data from Leanpath on the causes of unutilized food in foodservice combined with review and input from grocery retail subject matter experts. Leanpath is a technology company that helps foodservice companies track, weigh and analyze the amount of food that is wasted in commercial kitchens. Leanpath customers also indicate the reason the food was not used as well as the food type when using Leanpath’s automated software system. For more information, see Appendix M and the Foodservice Methodology section.
Steps taken to adapt the Leanpath foodservice cause data to be relevant for grocery retail: 1. Map Leanpath’s food types to similar grocery retail food types (e.g., Produce, Dry goods). 2. Filter out data for causes that are not relevant to the retail sector (e.g., Catering overproduction is not relevant for a grocery retail Produce department). 3. Quantify the causal breakdown of unused food by food type. 4. Have grocery retail subject matter experts review the data and compare it with numbers they’re used to seeing in the field and make adjustments accordingly.
Unsold Food Destinations
In 2016 FWRA conducted a national food waste survey of grocery retailers in which 24 grocery retailers responded (35.3% of U.S. market share based on sales)[42]. ReFED used the data from this survey to quantify the percentage destination breakdown of unsold food from U.S. grocery retailers by year, state, and food type (See Appendix N).
There are a few limitations in using the data in this way. Because it was a national study for all food types, the data does not reflect geographic variations by state or variations in disposal patterns for different food types. Also, because it was a one-time study, the data does not provide insight into changes in disposal habits over time. See Appendix N for a breakdown of unsold food destinations.
Data Quality Evaluation
This rubric is designed to evaluate the quality of how each data source was utilized by ReFED to estimate food loss and waste. It is not meant to rate the quality of the study itself. See Appendix AA for more information about the ReFED Data Quality Rubric.
DATA |
SOURCE |
DATA QUALITY SCORE |
||||||
|---|---|---|---|---|---|---|---|---|
CREDIBILITY |
UPDATE FREQUENCY |
COVERAGE |
FOOD TYPE |
GEOGRAPHY |
SCORE |
WEIGHT |
||
RETAIL SURPLUS DATA |
||||||||
US Dollars Sold |
Nielsen Point-of-sale (POS) |
4 |
5 |
5 |
5 |
5 |
High 24/5 = 4.8 |
25% |
Tons Sold |
Nielsen Point-of-sale (POS) |
4 |
5 |
5 |
5 |
5 |
High 24/5 = 4.8 |
25% |
Unsold Food Rate |
USDA Supermarket Shrink Estimates for ERS LAFA FMI Supermarket Security and Loss Prevention Report |
4 |
3 |
2 |
3 |
3 |
Medium 15/5 = 3.0 |
50% |
4.8 * 25% + 4.8 * 25% + 3.0 * 50% = 3.9 |
Medium |
|||||||
RETAIL CAUSES DATA |
||||||||
% Unsold Food Due to Cause |
Expert Interviews |
1 |
1 |
1 |
3 |
1 |
Very Low 7/5 = 1.4 |
100% |
1.4 * 100% = 1.4 |
Very Low |
|||||||
RETAIL DESTINATIONS DATA |
||||||||
% Destination Breakdown |
FWRA Surveys |
4 |
1 |
2 |
1 |
3 |
Low 11/5 = 2.2 |
95% |
% of Trash landfill vs incineration |
Biocycle/Columbia University Survey |
5 |
1 |
5 |
1 |
5 |
Medium 17/5 = 3.4 |
5% |
2.2 * 95% + 3.4 * 5% = 2.26 |
Low |
|||||||