Appendix
Appendix A: Farm Yield Left Behind After Harvest
<insert table>
Appendix B: Farm Field Packing Rates for Fresh Market Produce
<insert table>
Appendix C: Buyer Rejection Rates
ReFED consulted experts to estimate the percentage of food that is delivered by suppliers but rejected by commercial buyers.
<insert table>
Appendix D: Causes of Fields Never Harvested (Walk-by Fields)
The following table displays example data for 2019 Michigan crop insurance claims for “All Other Crops” from the USDA Risk Management Agency[50]. Similar data is available for all years across all states for dozens of farm commodities.
<insert table>
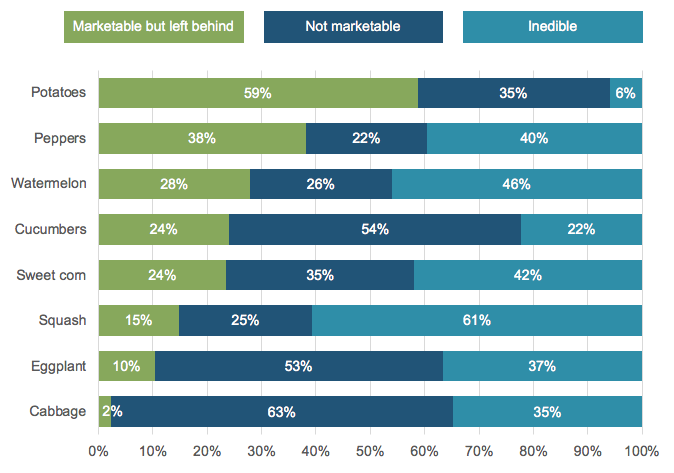
Appendix E: Causes of Yield Left Behind After Harvest
2018 NC State Studies of fields in North Carolina[26],[25]
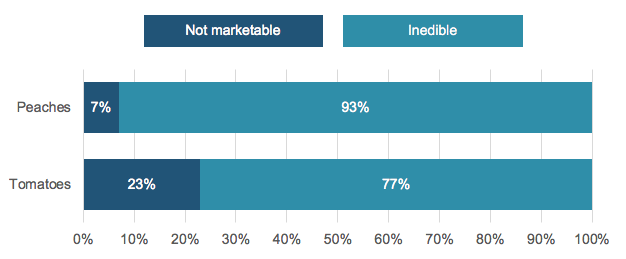
Appendix F: Causes of Packhouse Losses
2017 WWF Specialty Crop Loss Report[29] of 16 packhouses (6 peach packhouses, 10 tomato packhouses)
Appendix G: Destinations of Packhouse Losses
ReFED used data from the WWF Specialty Crop Loss Report[29] to estimate the following breakdown of produce packhouse loss destinations:
<insert table>
Appendix H: Retail Margins
Each year the U.S. Census Bureau conducts the Annual Retail Trade Survey[4], which includes gross margins from retail firms broken out by business types including grocery food and beverage stores.
<insert table>
Appendix I: Unshipped Product Rates and Ingredient Utilization Rates
ReFED used data from Tesco supplier food waste case studies[45] to quantify the percentage of food manufacturing ingredients that get utilized in finished product as well as the percentage of finished manufactured food that does not ultimately get shipped to buyers. ReFED identified specific suppliers to serve as proxies for different manufacturing types. See the raw data and documentation for more information:
Ingredient Utilization Rates: https://refed-roadmap.s3-us-west-2.amazonaws.com/public_documentation/Documentation_Manufacturing_RecipesAndUtilizationRates.xlsx
Unshipped Product Rates: https://refed-roadmap.s3-us-west-2.amazonaws.com/public_documentation/Documentation_Manufacturing_UnshippedProductRates.xlsx
<insert table>
Appendix J: Destinations of Manufacturing Surplus
ReFED used custom-prepared food waste destinations data from Northstar Recycling[59] to estimate the destination breakdown of food surplus by food manufacturing type. Northstar Recycling is a national waste and recycling company that manages waste for many food manufacturers across the U.S. and Canada. This dataset was used to estimate the destinations of both unutilized ingredients and finished product surplus as these surplus streams are mixed together in the data.
<insert table>
* Because Northstar does not manage food waste for any meat processing facilities, ReFED assumed that 100% of unutilized ingredients at meat processing plants were sent to rendering (industrial uses).
** Northstar does not have visibility to food donations data for their clients, so ReFED assumed that 1% of unutilized ingredients are donated based on data from the 2016 Food Waste Reduction Alliance survey[14] in which 9 manufacturers responded (6.2% of U.S. market share based on sales).
*** Northstar does not have visibility to food washed down the sewer. This data was also not included in the FWRA surveys. Further research is needed to fill in this data gap.
Appendix K: Retail Unsold Food Rates: USDA Supermarket Shrink Estimates
ReFED mapped the USDA commodities from the USDA Supermarket Shrink Estimates[53],[5] to each ReFED Food Category. When no reasonable proxies existed for a specific category (e.g., Bagels), unsold food rates from Food Marketing Institute (FMI) Supermarket Security and Loss Prevention Report[13] were used instead (see Appendix L). The following numbers are based on supplier purchases and customer sales data from five individual retailers representing 45 states and 2,900 stores. Find the full report at: https://www.ers.usda.gov/publications/eibeconomic-informationbulletin/eib155
<insert table>
Appendix L: Retail Unsold Food Rates: FMI Supermarket Security and Loss Prevention Report
Based on 2008 FMI survey of 50 supermarket survey participants[13]
<insert table>
Appendix M: Causes of Retail Surplus
As a placeholder until further research can be done, ReFED developed estimates using data from Leanpath[30] on the causes of unutilized food in foodservice combined with review and input from grocery retail subject matter experts. Leanpath is a technology company that helps foodservice companies track, weigh and analyze the amount of food that is wasted in commercial kitchens. Leanpath customers also indicate the reason the food was not used as well as the food type when using Leanpath’s automated software system.
Steps taken to adapt the Leanpath foodservice cause data to be relevant for grocery retail:
Map Leanpath’s food types to similar grocery retail food types (e.g., Produce, Dry goods).
Filter out data for causes that are not relevant to the retail sector (e.g., Catering overproduction is not relevant for a grocery retail Produce department).
Quantify the causal breakdown of unused food by food type.
Have grocery retail subject matter experts review the data and compare it with numbers they’re used to seeing in the field and make adjustments accordingly.
<insert table>
Appendix N: Destinations of Retail Surplus
This data was obtained from a 2016 FWRA survey[14] of grocery retailers in which 24 grocery retailers responded (35.3% of U.S. market share based on sales).
<insert table>
* Note that ReFED removed the portion of disposal listed as “Other” for modeling purposes.
** For improved state-level modeling, ReFED grouped together the Incineration and Landfill numbers into a “Trash” percentage. BioCycle survey data[42] conducted in partnership with Columbia University[8] was used to estimate state-specific landfill and incineration numbers
Appendix O: Foodservice Food Type Breakdown and Wholesale Prices
ReFED used menu data from Technomic[44] in combination with food ingredient breakdown data from USDA Food Data Central[52] to estimate the food ingredient breakdown of multiple menus. The Technomic menu data listed all of the items on a menu for the Top 500 restaurants (e.g., Cheeseburger, Fries, etc.). ReFED mapped each menu item to the closest matching food item in the USDA Food Data Central database, which provides the ingredient weight breakdown of each food (e.g., A cheeseburger is 38% ground beef, 27% bread, 9% cheese, 9% tomato, 7% sauce, 7% pickles, 4% lettuce). Each foodservice segment was assigned a proxy menu based on the top restaurant by sales in each segment (e.g., McDonald’s menu was used as a proxy for Limited Service Burger Restaurants). For non-restaurant segments, a restaurant proxy menu was used. ReFED then calculated average wholesale price per lb estimates for each foodservice segment by subtracting retailer markups[4] from Nielsen retail prices[38] for the hundreds of food categories (e.g., Cheese) mapped to each food department (e.g., Dairy & Eggs).
FSR = Full Service Restaurants, LSR = Limited Service Restaurants
<insert table>
Appendix P: Plate Waste Rates
ReFED used multiple quantitative studies conducted by nonprofits, academics, and government organizations to estimate plate waste rates[41],[32],[15],[12],[43]. ReFED identified the latest, most suitable study available to use as a proxy for plate waste rates in each foodservice segment.
<insert table>
Appendix Q: Catering Overproduction Rates
Based on expert interviews with catering organizations, ReFED estimated the percentage of food that isnever served to clients at catering events. The results were the following:
<insert table>
Appendix R: Causes of Foodservice Pre-Consumer Surplus
ReFED used data from Leanpath[30] to estimate the following causal breakdown of foodservice pre-consumer surplus by food type. The following data is from 2019.
Proxy assignments:
Business & Industry used as proxy for: Military, Refreshment Services
Education used as proxy for: Corrections, Other
Hospitality used as proxy for : All restaurants, Bars and Taverns, Lodging, Recreation, Transportation, Caterers
Appendix S: Destinations of Foodservice Pre-Consumer Surplus
For most states, ReFED used data from the 2016 Food Waste Reduction Alliance (FWRA) survey[14] of restaurants in which 28 restaurant companies responded (11.8% of U.S. market share based on sales) to estimate the destination breakdown of pre-consumer surplus. Data on industrial uses (or biomaterials/processing) was excluded because most of this is spent cooking oil rather than pre-consumer surplus. Since the FWRA data indicated that 94% of pre-consumer surplus is landfilled, which is not the case in states that have organics recycling laws, ReFED instead used data from Leanpath to estimate the pre-consumer surplus destinations for these states (California, Connecticut, Massachusetts, Oregon, Vermont, and Washington). ReFED did not use the Leanpath data for all other states to avoid selection bias as Leanpath clients may be more likely to compost food scraps than the average foodservicebusiness.
FWRA Restaurant Survey Data:
<insert table>
* Note that ReFED removed the portion of disposal listed as “Other” for modeling purposes.
** Data on industrial uses (or biomaterials/processing) was excluded because most of this is spentcooking oil rather than pre-consumer surplus.
***For improved state-level modeling, ReFED grouped together the Incineration and Landfill numbers into a “Trash” percentage. BioCycle survey data[42] conducted in partnership with Columbia University[8] was used to estimate state-specific landfill and incineration numbers.
Leanpath pre-consumer surplus destinations data for states with organics recycling laws:
<insert table>
Appendix T: Destinations of Foodservice Plate Waste
ReFED assumed that plate waste was sent to “Trash” in all states, except states that have organics recycling laws. For these states (California, Connecticut, Massachusetts, Oregon, Vermont, and Washington), Leanpath plate waste destinations data[30] was used instead. ReFED did not use the Leanpath data for all other states to avoid selection bias as Leanpath clients may be more likely to compost food scraps than the average foodservice business.
Leanpath plate waste destinations data for states with organics recycling laws:
<insert table>
Appendix U: Destinations of Foodservice Catering Overproduction
ReFED assumed that catering overproduction was sent to “Trash” in all states, except states that have organic waste recycling laws. For states with organics recycling laws (California, Connecticut, Massachusetts, Oregon, Vermont, and Washington), Leanpath catering overproduction destinations data[30] was used instead. ReFED did not use the Leanpath data for all other states to avoid selection bias as Leanpath clients may be more likely to compost food scraps than the average foodservice business.
Leanpath catering overproduction destinations data for states with organics recycling laws:
<insert table>
Appendix V: % of Food Obtained From Grocery Stores
ReFED used USDA NHANES data[51] to quantify the portion of each food type that is obtained from grocery stores versus other sources (e.g., restaurants, food pantries, convenience stores). These numbers were generated for each year dating back to 2010. The numbers in the table below are for 2019, using values from the most recent NHANES survey (2015-2016). See ReFED’s raw data and documentation for more information: https://refed-roadmap.s3-us-west-2.amazonaws.com/public_documentation/Documentation_Residential_GroceryRates.xlsx
<insert table>
Appendix X: Causes of Residential Surplus
ReFED used data from NRDC Home Kitchen Diaries[35] to estimate the causal breakdown of residential food waste. Study averages were used, because there was very little variation in results across the three areas studied (New York City, Nashville, and Denver). ReFED mapped the NRDC reason names to the ReFED equivalent cause names.
<insert table>
Appendix Y: Destinations of Residential Surplus
ReFED used data from NRDC Home Kitchen Diaries[35] to estimate the destination breakdown of residential food waste. Study averages were used, because there was very little variation in results across the three areas studied (New York City, Nashville, and Denver).
<insert table>
Appendix Z: Landfill and Incineration Rates
Data Source: BioCycle State of Garbage in America Surveys[42] conducted in partnership with the Earth Engineering Center at Columbia University[8]
Appendix AA: Data Quality Rubric
<insert table>
ReFED developed the following rubric to evaluate the quality of each data source utilized to estimate food loss and waste.
<insert table>