Residential Methodology
Scope Boundary
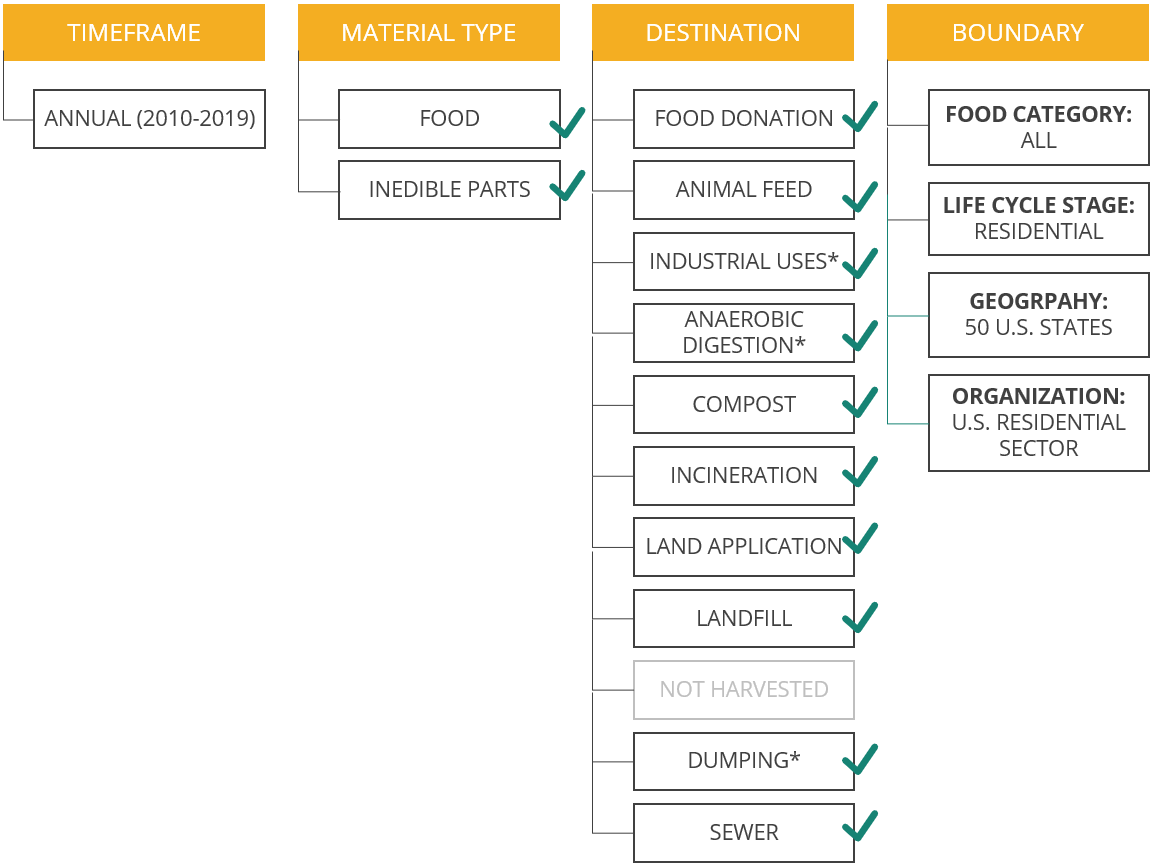
This diagram communicates the scope boundary as aligned with the Food Loss and Waste Accounting and Reporting Standard[17]. Note that ReFED’s analysis also includes food sent to donations, although donations are not considered a destination within the Standard.
- NOTES
“Biomaterial Processing is referred to as “Industrial Uses” in our model
“Co/anaerobic digestion” is referred to as “Anaerobic digestion” in our model
“Controlled Combustion” is referred to as “Incineration” in our model
“Refuse/discards” is referred to as “Dumping” in our model
Calculations
Surplus Food Calculations
In ReFED’s data model, the following calculations are repeated for every state, year, and food type before any aggregation is done.
DATA ITEM |
DATA SOURCE OR CALCULATION |
EXAMPLE |
|---|---|---|
US Dollars Purchased from Grocery Stores |
Nielsen Point-of-Sale (POS) Data[38] |
$43,334,294 worth of Tomatoes purchased from grocery stores in Arkansas in 2021 |
Tons Purchased fron Grocery Stores |
Nielsen Point-of-Sale (POS) Data[38] |
9,971 tons Tomatoes purchased from grocery stores in Arkansas in 2021 |
Retail Price per Lb |
= US Dollars Purchased from Grocery Stores / Tons Purchased from Grocery Stores / 2,000 lbs per ton
See U.S. Grocery Retail Dollar-to-Weight Conversion Factors Report[40] for more information on the price per lb data.
|
= $43,334,294 worth of Tomatoes purchased / 9,971 tons Tomatoes purchased / 2,000 lbs per ton
= $2.17 per lb
|
% of Food Obtained from Grocery Stores |
USDA NHANES Survey[51] |
90.80% of Tomatoes obtained from grocery stores (as opposed to restaurants, farmers markets, food banks, gas stations, home gardens, etc.) |
Tons Obtained Elsewhere |
= Tons Purchased from Grocery Stores * (100% - % of Food Obtained from Grocery Stores) / % of Food Obtained from Grocery Stores |
= 9,971 tons purchased from grocery * (100% - 90.80%) / 90.80%
= 1,010 tons Tomatoes obtained elsewhere
|
Surplus Rate |
National Household Food Waste Tracking Survey [39] |
= 21.87% of Tomatoes brought home are wasted |
Tons Surplus |
= ( Tons Purchased from Grocery Stores + Tons Obtained Elsewhere) * Surplus Rate |
= (9,971 tons purchased from grocery + 1,010 tons obtained elsewhere ) * 21.87%
= 2,401 tons Tomatoes surplus
|
US Dollars Surplus |
= Tons Surplus * Retail Price per Lb * 2,000 lbs per ton |
= 2,401 tons Tomatoes surplus * $2.17 per lb
= $10,436,232 surplus
|
Cause Calculations
DATA ITEM |
DATA SOURCE OR CALCULATION |
EXAMPLE |
|---|---|---|
% Surplus due to Cause |
NRDC Home Kitchen Diaries[35] |
Example data breakdown of home food waste causes for produce (See Appendix X for other food types):
Considered inedible: 16.20%
Cooking issues: 0.26%
Date label concerns: 0.85%
Didn’t taste good: 2.49%
Didn’t want leftovers: 2.06%
Inedible parts: 46.42%
Left out too long: 3.72%
Other: 3.79%
Spoiled: 22.85%
Too little save: 1.37%
————————————————
Total: 100%
|
Tons Surplus due to Cause |
= Tons Surplus * % Surplus due to Cause |
Tons due to Considered inedible:
= 2,401 tons Tomatoes surplus * 16.20%
= 388 tons
Tons due to Cooking issues:
= 2,401 tons Tomatoes surplus * 0.26%
= 6 tons
Tons due to Date label concerns:
= 2,401 tons Tomatoes surplus * 0.85%
= 20 tons
Tons due to Didn’t taste good:
= 2,401 tons Tomatoes surplus * 2.49%
= 59 tons
Tons due to Didn’t want leftovers:
= 2,401 tons Tomatoes surplus * 2.06%
= 49 tons
Tons due to Inedible parts:
= 2,401 tons Tomatoes surplus * 46.42%
= 1,114 tons
Tons due to Left out too long:
= 2,401 tons Tomatoes surplus * 3.72%
= 89 tons
Tons due to Other:
= 2,401 tons Tomatoes surplus * 3.79%
= 91 tons
Tons due to Spoiled:
= 2,401 tons Tomatoes surplus * 22.85%
= 548 tons
Tons due to Too little to save:
= 2,401 tons Tomatoes surplus * 1.37%
= 32 tons
|
US Dollars Surplus due to Cause |
= US Dollars Surplus * % Surplus due to Cause |
US Dollars due to Considered inedible:
= $10,436,232 Tomatoes surplus * 16.20%
= $1,690,431
US Dollars due to Cooking issues:
= $10,436,232 Tomatoes surplus * 0.26%
= $26,679
US Dollars due to Date label concerns:
= $10,436,232 Tomatoes surplus * 0.85%
= $88,947
US Dollars due to Didn’t taste good:
= $10,436,232 Tomatoes surplus * 2.49%
= $259,667
US Dollars due to Didn’t want leftovers:
= $10,436,232 Tomatoes surplus * 2.06%
= $214,499
US Dollars due to Inedible parts:
= $10,436,232 Tomatoes surplus * 46.42%
= $4,844,180
US Dollars due to Left out too long:
= $10,436,232 Tomatoes surplus * 3.72%
= $388,571
US Dollars due to Other:
= $10,436,232 Tomatoes surplus * 3.79%
= $395,741
US Dollars due to Spoiled:
= $10,436,232 Tomatoes surplus * 22.85%
= $2,384,197
US Dollars due to Too little to save:
= $10,436,232 Tomatoes surplus * 1.37%
= $143,315
|
Destination Calculations
DATA ITEM |
DATA SOURCE OR CALCULATION |
EXAMPLE |
|---|---|---|
Destination Breakdown of Residential Surplus |
NRDC Home Kitchen Diaries [35] |
According to the NRDC Home Kitchen Diaries, this was the destination breakdown of residential surplus for Produce (See Appendix Y for other food types):
Animal feed: 0.45%
Compost: __residential_example_percent_composting__%
Sewer: 1.30%
Trash: 52.32%
————————————————
Total: 100%
|
% of Trash that is landfill vs incineration in Arkansas
(BioCycle/Columbia University Survey)[8] (See Appendix Z)
|
% of Trash that is landfill = 100.00%
% of Trash that is incineration = 0.00%
|
|
Breaking “Trash” into Landfill vs Incineration:
% landfill = % Trash * % of Trash that is landfill
% incineration = % Trash * % of Trash that is incineration
|
% landfill:
= 52.32% * 100.00%
= __residential_example_landfill_rate__
% incineration:
= 52.32% * 0.00%
= __residential_example_incineration_rate__
|
|
Tons Animal Feed |
= Tons Surplus * % Animal Feed |
= 2,401 tons Tomatoes surplus * 0.45% animal feed
= 10 tons Tomatoes sent to animal feed
|
Tons composting |
= Tons Surplus * % composting |
= 2,401 tons Tomatoes surplus * __residential_example_percent_composting__% composting
= __residential_example_tons_composting__ tons Tomatoes composting
|
Tons Sewer |
= Tons Surplus * % Sewer |
= 2,401 tons Tomatoes surplus * 1.30% disposed down the drain
= 31 tons Tomatoes disposed via sewer
|
Tons landfill |
= Tons Surplus * % landfill |
= 2,401 tons Tomatoes surplus * 100.00% landfill
= __residential_example_tons_landfill__ tons Tomatoes landfill
|
Tons incineration |
= Tons Surplus * % incineration |
= 2,401 tons Tomatoes surplus * 0.00% incineration
= __residential_example_tons_incineration__ tons Tomatoes incineration
|
US Dollars Animal Feed |
= US Dollars Surplus * % Animal Feed |
= $10,436,232 Tomatoes surplus * 0.45% animal feed
= $46,702 Tomatoes sent to animal feed
|
US Dollars composting |
= US Dollars Surplus * % composting |
= $10,436,232 Tomatoes surplus * __residential_example_percent_composting__% composting
= $__residential_example_us_dollars_composting__ Tomatoes composting
|
US Dollars Sewer |
= US Dollars Surplus * % Sewer |
= $10,436,232 Tomatoes surplus * 1.30% disposed down the drain
= $135,360 Tomatoes disposed via sewer
|
US Dollars landfill |
= US Dollars Surplus * % landfill |
= $10,436,232 Tomatoes surplus * 100.00% landfill
= $__residential_example_us_dollars_landfill__ Tomatoes landfill
|
US Dollars incineration |
= US Dollars Surplus * % incineration |
= $10,436,232 Tomatoes surplus * 0.00% incineration
= $__residential_example_us_dollars_incineration__ Tomatoes incineration
|
Data Sources and Limitations
Retail Value and Tons Purchased at Grocery Stores
Nielsen data represents over 85% coverage of grocery retail sales in the U.S. Each year top U.S. grocery retailers report item level point-of-sale sales data to Nielsen[38], including information about each item such as the grocery chain where it was sold, the brand name of the product, the food classification (department, category, subcategory), the weight of food and packaging, and many other attributes. ReFED used this data to quantify the retail value and weight of food sold by grocery retailers in the U.S. by year, state, and food type. For more information about the weight data, see the U.S. Grocery Retail Dollar-to-Weight Conversion Factors report[40].
Nielsen provided point-of-sale data for the years 2016-2019. In order to estimate values for the missing years 2010-2015 each subcategory was extrapolated using category-level average year-over-year linear growth rates for both sales value and sales weight. Due to the high granularity of the categories, there were some cases where the growth rates were either extremely high or extremely low. To avoid unrealistic growth estimations over time within these outlier categories, department-level growth rates were used instead if a category had a growth rate ±15%. These outlier categories represent 0.5% of total sales.
The accuracy of these estimates is limited to the accuracy of the Nielsen sales and weight data. The weight data for UPC items comes directly from up-to-date product packaging images. For non-UPC items sold in eaches, Nielsen estimates weight using a weight conversion factor (e.g., the average weight of a lemon). For other non-UPC items, Nielsen is reliant on the retailer transaction data to provide the item sale weight units (e.g., lbs of apples sold).
Food Obtained from Grocery Stores vs Elsewhere
Residential Food Surplus Rates
As of 2023, ReFED is now estimating residential waste using research produced by a collaborative effort between the Ohio State Food Waste Collaborative and the Multiscale RECIPES Sustainable Regional Systems Research Network[39], led by Professor Brian Roe. Since 2021, surveys of household food waste habits have been conducted three times a year, in which weekly per capita waste in grams is estimated for 24 foods.
To calculate the loss rate, weekly per capita waste is scaled to total tons of residential waste. This annual waste is then scaled to account for inedible waste and by respondent underreporting. The loss rate is then calculated by dividing total annual waste in tons by total sales in tons, which is derived from Nielsen IQ sales data.
Since the survey data begins in 2021, 2016-2019 estimates are backfilled by multiplying 2023 surplus rates by total sales for each year. We assume that pre-COVID consumer waste behavior is similar to that of 2023, which appears to be a return to pre-pandemic “normalcy”. This “return” is evident in the overall increase in per capita sales and a major return to dining out, in spite of record high food prices. For 2020, we calculated waste rates based on survey results from a single wave, conducted in February 2021.
We validated the household waste estimates by cross-referencing them with an in-house systematic review of waste characterization studies, which analyzed residential waste generation data collected from more than 20 states over the past 20 years to set a rough baseline for household waste in landfills.
This new methodology allows us to produce a more accurate estimate, and importantly, to measure change over time in both absolute and relative consumer waste.
- Nevertheless, calculating total annual waste required making several assumptions that introduce uncertainty. This includes:
Scaling estimates to account for respondent underreporting, a well-documented phenomenon
Scaling estimates to account for inedible parts
Accounting for elevated waste during holidays
Mapping food categories used in the surveys to ReFED’s food categories.
Previously, ReFED used the USDA Consumer-Level Food Loss Estimates [34] [53], which are the basis of the USDA ERS Loss-Adjusted Food Availability per Capita Dataset [5].
Residential Food Surplus Causes
Raw data and documentation: - https://refed-roadmap.s3-us-west-2.amazonaws.com/public_documentation/Documentation_Residential_CauseBreakdown_2010-2014.xlsx - https://refed-roadmap.s3-us-west-2.amazonaws.com/public_documentation/Documentation_Residential_CauseBreakdown_2015-2019.xlsx
As a part of a three-city study (New York, Nashville, Denver), Natural Resources Defense Council (NRDC) conducted an in-home study[35] where participants documented the weight and type of foods wasted over a two week period. Participants also documented the reason why they wasted the food and what they did with it (e.g., disposed of down the drain, trash, fed to animals, composting). ReFED used this data to quantify the causes of residential food waste by year, state, and food type.
Residential Food Surplus Destinations
ReFED also used the NRDC Home Kitchen Diaries[35] to quantify the destination breakdown of residential food surplus. The same strengths and weaknesses of the causal data listed above apply to the destinations component of the study as well. Additionally, it’s possible that the residential composting numbers may be higher than the U.S. average due to selection bias of the people that chose to participate in the study.
Data Quality Evaluation
This rubric is designed to evaluate the quality of how each data source was utilized by ReFED to estimate food loss and waste. It is not meant to rate the quality of the study itself. See Appendix AA for more information about the ReFED Data Quality Rubric.
Table 20. Data Quality Evaluation for Food Waste Monitor Residential Sector
DATA |
SOURCE |
DATA QUALITY SCORE |
||||||
|---|---|---|---|---|---|---|---|---|
CREDIBILITY |
UPDATE FREQUENCY |
COVERAGE |
FOOD TYPE |
GEOGRAPHY |
SCORE |
WEIGHT |
||
RESIDENTIAL SURPLUS DATA |
||||||||
Retail Value Purchased at Grocery Stores |
Nielsen Point-of-sale (POS) Data |
4 |
5 |
5 |
5 |
5 |
High 24/5 = 4.8 |
17% |
Tons Purchased at Grocery Stores |
Nielsen Point-of-sale (POS) Data |
4 |
5 |
5 |
5 |
5 |
High 24/5 = 4.8 |
17% |
% of Food Obtained from Grocery Stores |
USDA NHANES Survey |
5 |
5 |
5 |
5 |
3 |
High 23/5 = 4.6 |
33% |
Surplus Rate |
National Household Food Waste Tracking Survey |
4 |
5 |
5 |
4 |
3 |
High 21/5=4.2 |
33% |
4.8 * 17% + 4.8 * 17% + 4.6 * 33% + 4.2 * 33% = 4.54 |
High |
|||||||
RESIDENTIAL CAUSES DATA |
||||||||
% Surplus Due to Cause |
NRDC Home Kitchen Diaries |
5 |
1 |
1 |
4 |
2 |
Low 13/5 = 2.6 |
100% |
2.6 * 100% = 2.6 |
Low |
|||||||
RESIDENTIAL DESTINATIONS DATA |
||||||||
% Destination Breakdown |
NRDC Home Kitchen Diaries |
5 |
1 |
1 |
4 |
2 |
Low 13/5 = 2.6 |
95% |
% of Trash landfill vs incineration |
Biocycle/Columbia University Survey |
5 |
1 |
5 |
1 |
5 |
Medium 17/5 = 3.4 |
5% |
2.6 * 95% + 3.4 * 5% = 2.64 |
Low |
|||||||