Farm Methodology
Scope Boundary
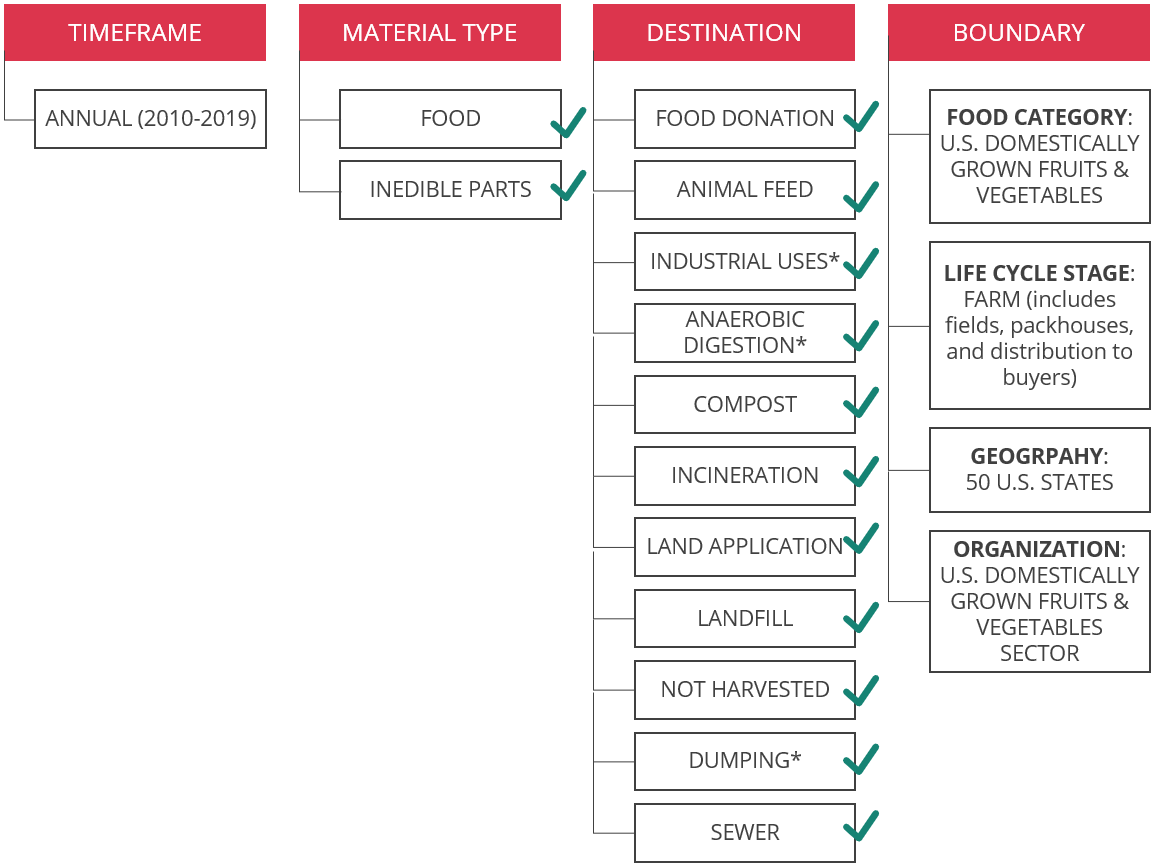
This diagram communicates the scope boundary as aligned with the Food Loss and Waste Accounting and Reporting Standard[17]. Note that ReFED’s analysis also includes food sent to donations, although donations are not considered a destination within the Standard.
- NOTES
“Food Donation” has been added as a Destination
“Biomaterial Processing is referred to as “Industrial Uses” in our model
“Co/anaerobic digestion” is referred to as “Anaerobic digestion” in our model
“Controlled Combustion” is referred to as “Incineration” in our model
“Refuse/discards” is referred to as “Dumping” in our model
Calculations
Surplus Food Calculations
In ReFED’s data model, the following calculations are repeated for every state, year, and farm produce commodity before any aggregation is done.
DATA ITEM |
DATA SOURCE OR CALCULATION |
EXAMPLE |
|---|---|---|
Acres Planted |
USDA Surveys |
9,500 acres of Asparagus planted in Michigan in 2021 |
Acres Harvested |
USDA Surveys |
8,900 acres of Asparagus harvested in Michigan in 2021 |
Acres Unharvested |
= Acres Planted - Acres Harvested |
= 9,500 - 8,900
= 600 acres unharvested
|
US Dollars Harvested |
USDA Surveys[54] |
$22,060,000 of Asparagus harvested in Michigan in 2021 |
Tons Harvested |
USDA Surveys[54] |
12,460 tons of Asparagus produced in Michigan in 2021 |
Yield Tons per Acre |
= Tons Harvested / Acres Harvested |
= 12,460 tons produced / 8,900 acres harvested
= 1.40 tons per acre
|
% Maturity of Fields Never Harvested |
ReFED assumption |
In lieu of available data, ReFED assumed that only 50% of produce fields that are planted but never harvested reach maturity (yield produce that could be eaten) as opposed to fields that are planted but discontinued before the crop bears fruit. |
Tons Never Harvested (Walk-by Fields) |
= Acres Unharvested * Yield Tons per Acre * % Maturity of Fields Never Harvested |
= 600 acres unharvested * 1.40 tons per acre * 50
= 420 tons never harvested
|
% Yield Left Behind After Harvest Farm |
Proxy commodity: Cabbage
Study: 2019 Santa Clara University
11.96% marketed yield of cabbage left behind after harvest (See Appendix A)
|
|
Tons Left Behind After Harvest |
= Acres Harvested * Yield Tons per Acre * % Yield Left Behind After Harvest |
= 8,900 acres harvested * 1.40 tons per acre * 11.96% left behind after harvest
= 1,490 tons left behind after harvest
|
Tons Unharvested Total |
= Tons Never Harvested + Tons Left Behind After Harvest |
= 420 tons never harvested + 1,490 tons left behind after harvest
= 1,910 total tons unharvested
|
% Processing (as opposedto Fresh Market) |
USDA Surveys[54] |
53.20% of Asparagus grown in Michigan in 2019 went to the processing market |
% Field Packed |
Public Agriculture Websites[55],[47],[6],[__citation_UC_Davis_Asparagus__],[48],[57] |
According to the University of California Division of Agriculture and Natural Resources,
0.00% of Asparagus is field packed
|
% Packhouse Loss Rate |
WWF Specialty Crop Loss Report[29] |
Proxy commodity: Potatoes
14.80% losses by weight at the packhouse
|
Tons Sent to Packhouses |
= Tons Harvested * ( 100% - % Processing ) * ( 100% - % Field Packed ) |
= 12,460 tons harvested * ( 100% - 53.20% processing ) * ( 100% - 0.00% field packed )
= 5,831 tons sent to packhouses
|
Tons Packhouse Losses |
= Tons Sent to Packhouses * % Packhouse Loss Rate |
= 5,831 tons sent to packhouses * 14.80% packhouse losses
= 862 tons packhouse losses
|
% Buyer Rejection Rate |
Expert Interviews |
According to experts, about 2.00% of produce deliveries are rejected by the quality assurance team at buyer receiving (See Appendix C) |
Tons Shipped from Packhouse |
= Tons Sent to Packhouse - Tons Packhouse Losses |
= 5,831 tons sent to packhouse - 862 tons packhouse losses
= 4,968 tons shipped from packhouse
|
% of Buyer Rejections Sold via Discount Outlets |
Expert interviews |
Based on expert interviews, ReFED assumed that 25.00% of produce rejected by buyer quality assurance teams ends up being sold via other channels and does not get wasted. |
Tons Unsold Buyer Rejections |
= Tons Shipped from Packhouse * % Buyer Rejection Rate * ( 100% - % of Buyer Rejections Sold via Discount Outlets ) |
= 4,968 tons shipped from packhouse * 2.00% buyer rejections * (100% - 25.00% sold via discount outlets)
= 74 tons unsold buyer rejections
|
Price per Ton |
= US Dollars Harvested / Tons Harvested |
= $22,060,000 harvested / 12,460 tons harvested
= $1,770 per ton
|
US Dollars Never harvested |
= Tons Never Harvested * Price per Ton |
= 420 tons never harvested * $1,770 per ton
= $743,595 never harvested
|
US Dollars Left Behind After Harvest |
= Tons Left Behind After Harvest * Price per Ton |
= 1,490 tons left behind after harvest * $1,770 per ton
= $2,638,375 left behind after harvest
|
US Dollars Unharvested Total |
= US Dollars Never Harvested + US Dollars Left Behind After Harvest |
= $743,595 never harvested + $2,638,375 left behind after harvest
= $3,381,971 total unharvested
|
US Dollars Packhouse Losses |
= Tons Packhouse Losses * Price per Ton |
= 862 tons packhouse losses * $1,770 per ton
= $1,527,898 packhouse losses
|
US Dollars Unsold Buyer Rejections |
= Tons Unsold Buyer Rejections * Price per Ton |
= 74 tons unsold buyer rejections * $1,770 per ton
= $131,936 unsold buyer rejections
|
Tons Surplus |
= Tons Never Harvested + Tons Left Behind After Harvest + Tons Packhouse Losses + Tons Unsold Buyer Rejections |
= 420 tons never harvested + 1,490 tons left behind after harvest + 862 tons packhouse losses + 74 tons unsold buyer rejections
= 2,847 tons surplus
|
Tons Supply |
= Tons Unharvested + Tons Harvested |
= 1,910 total tons unharvested + 12,460 tons harvested
= 14,370 tons supply
|
% Surplus |
= Tons Surplus / Tons Supply |
= 2,847 tons surplus / 14,370 tons supply
= 19.82% surplus
|
US Dollars Surplus |
= US Dollars Never Harvested + US Dollars Left Behind After Harvest + US Dollars Packhouse Losses + US Unsold Dollars Unsold Buyer Rejections |
= $743,595 never harvested + $2,638,375 left behind after harvest + $1,527,898 packhouse losses + $131,936 unsold buyer rejections
= $5,041,806 surplus
|
US Dollars Supply |
= US Dollars Unharvested + US Dollars Harvested |
= $3,381,971 total unharvested + $22,060,000 harvested
= $25,441,971 supply
|
Cause Calculations
DATA ITEM |
DATA SOURCE OR CALCULATION |
EXAMPLE |
|
|---|---|---|---|
NEVER HARVESTED CAUSES |
|||
% Loss due to Cause |
USDA RMA Crop Insurance[50] |
Proxy commodity: “All Other Crops” was used because Asparagus acreage was relatively smaller than other commodities and was aggregated into the All Other Crops category in the USDA RMA data.
See example data in Appendix D
Fields never harvested (bad weather): 97.39%
Fields never harvested (food safety): 0.00%
Fields never harvested (market dynamics): 2.43%
Fields never harvested (pests/disease): 0.00%
Fields never harvested (other): 0.18%
|
|
Tons Surplus due to Cause |
= Tons Never Harvested * % Loss due to Cause |
Fields never harvested (bad weather):
= 420 tons never harvested * 97.39%
= 409 tons
Fields never harvested (food safety):
= 420 tons never harvested * 0.00%
= 0 tons
Fields never harvested (market dynamics):
= 420 tons never harvested * 2.43%
= 10 tons
Fields never harvested (pests/disease):
= 420 tons never harvested * 0.00%
= 0 tons
Fields never harvested (other):
= 420 tons never harvested * 0.00%
= 0 tons
|
|
US Dollars Surplus due to Cause |
= US Dollars Never Harvested * % Loss due to Cause |
Fields never harvested (bad weather):
= $743,595 never harvested * 97.39%
= $724,187
Fields never harvested (food safety):
= $743,595 never harvested * 0.00%
= $0
Fields never harvested (market dynamics):
= $743,595 never harvested * 2.43%
= $18,076
Fields never harvested (pests/disease):
= $743,595 never harvested * 0.00%
= $0
Fields never harvested (other):
= $743,595 never harvested * 0.18%
= $1,331
|
|
LEFT BEHIND AFTER HARVEST CAUSES |
|||
% Loss due to Cause |
Proxy commodity: Cabbage
See example data in Appendix E
Study: 2018 NC State
34.77% Left behind after harvest (inedible)
2.28% Left behind after harvest (marketable)
62.94% Left behind after harvest (not marketable)
Total = 100%
|
||
Tons Surplus due to Cause |
= Tons Left Behind After Harvest * % Loss due to Cause |
Left behind after harvest (inedible):
= 1,490 tons left behind after harvest * 34.77%
= 518 tons
Left behind after harvest (marketable):
= 1,490 tons left behind after harvest * 2.28%
= 34 tons
Left behind after harvest (not marketable):
= 1,490 tons left behind after harvest * 62.94%
= 937 tons
|
|
US Dollars Surplus due to Cause |
= US Dollars Left Behind After Harvest * % Loss due to Cause |
Left behind after harvest (inedible):
= $2,638,375 left behind after harvest * 34.77%
= $917,482
Left behind after harvest (marketable):
= $2,638,375 left behind after harvest * 2.28%
= $60,275
Left behind after harvest (not marketable):
= $2,638,375 left behind after harvest * 62.94%
= $1,660,617
|
|
PACKHOUSE LOSS CAUSES |
|||
% Loss due to Cause |
WWF Specialty Crop Loss Report[29] |
Proxy commodity: Tomatoes
See example data in Appendix F
77.00% Packhouse losses (inedible)
23.00% Packhouse losses (not marketable)
Total = 100%
|
|
Tons Surplus due to Cause |
= Tons Harvested but Not Sold * % Loss due to Cause |
Packhouse losses (inedible):
= 862 tons packhouse losses * 77.00%
= 664 tons
Packhouse losses (not marketable):
= 862 tons packhouse losses * 23.00%
= 198 tons
|
|
US Dollars Surplus due to Cause |
= US Dollars Harvested but Not Sold * % Loss due to Cause |
Packhouse losses (inedible):
= $1,527,898 packhouse losses * 77.00%
= $1,176,481
Packhouse losses (not marketable):
= $1,527,898 packhouse losses * 23.00%
= $351,416
|
|
BUYER REJECTIONS |
|||
Tons Unsold Buyer Rejections |
See calculation above for Tons Unsold Buyer Rejections |
= 74 tons unsold buyer rejections |
|
US Dollars Unsold Buyer Rejections |
See calculation above for US Dollars Unsold Buyer Rejections |
= $131,936 unsold buyer rejections |
|
Destination Calculations
DATA ITEM |
DATA SOURCE OR CALCULATION |
EXAMPLE |
|
|---|---|---|---|
Destination Breakdown of Packhouse Losses |
WWF Specialty Crop Loss Report[29] |
This was the destinations breakdown for the packhouses included in the WWF report (See Appendix G):
donations: __farm_example_packhouse_loss_destinations_percent_donations__%
Animal feed: 69.67%
Refuse/discards: __farm_example_packhouse_loss_destinations_percent_dumping__%
————————————————
Total: 100%
|
|
Destination Breakdown of Unsold Buyer Rejections |
Expert Interviews |
According to expert interviews, this is what happens to buyer rejections that don’t get sold via secondary outlets:
donations: __farm_example_farm_unsold_buyer_rejections_percent_donations__%
Animal feed: 33.33%
Refuse/discards: __farm_example_farm_unsold_buyer_rejections_percent_dumping__%
Trash: 33.33%
————————————————
Total: 100%
|
|
% of Trash that is landfill vs incineration in Michigan (Biocycle/Columbia University Survey[42]) (See Appendix Z) |
% of Trash that is landfill = 92.30%
% of Trash that is incineration = 7.70%
|
||
Breaking “Trash” into Landfill vs Incineration:
% landfill = % Trash * % of Trash that is landfill
% incineration = % Trash * % of Trash that is incineration
|
% landfill:
= 33.33% * 92.30%
= __farm_example_farm_unsold_buyer_rejections_percent_landfill__%
% incineration:
= 33.33% * 7.70%
= __farm_example_farm_unsold_buyer_rejections_percent_incineration__%
|
||
Tons Not Harvested |
= Total Tons Fields Never Harvested + Total Tons Left Behind After Harvest |
= 420 tons fields never harvested + 1,490 tons left behind after harvest
|
= 1,910 total tons unharvested
|
US Dollars Not Harvested |
= Total US Dollars Fields Never Harvested + Total US Dollars Left Behind After Harvest |
= $743,595 fields never harvested + $2,638,375 left behind after harvest
|
= $3,381,971 total unharvested |
Tons donations |
Tons Packhouse Losses * % Donations for Packhouse Losses + Tons Unsold Buyer Rejections * % Donations for Unsold Buyer Rejections |
= 862 tons packhouse losses * __farm_example_packhouse_loss_destinations_percent_donations__% donations + 74 tons unsold buyer rejections * __farm_example_farm_unsold_buyer_rejections_percent_donations__% donations
= __farm_example_tons_donations__ tons donations
|
|
US Dollars donations |
US Dollars Packhouse Losses * % Donations for Packhouse Losses + US Dollars Unsold Buyer Rejections * % Donations for Unsold Buyer Rejections |
= $1,527,898 packhouse losses * __farm_example_packhouse_loss_destinations_percent_donations__% donations + $131,936 unsold buyer rejections * __farm_example_farm_unsold_buyer_rejections_percent_donations__% donations
= $__farm_example_us_dollars_donations__ donations
|
|
Tons Animal Feed |
Tons Packhouse Losses * % Animal feed for Packhouse Losses + Tons Unsold Buyer Rejections * % Animal feed for Unsold Buyer Rejections |
= 862 tons packhouse losses * 69.67% Animal feed + 74 tons unsold buyer rejections * 33.33% Animal feed
= 626 tons Animal feed
|
|
US Dollars Animal Feed |
US Dollars Packhouse Losses * % Animal feed for Packhouse Losses + US Dollars Unsold Buyer Rejections * % Animal feed for Unsold Buyer Rejections |
= $1,527,898 packhouse losses * 69.67% Animal feed + $131,936 unsold buyer rejections * 33.33% Animal feed
= $1,108,476 Animal feed
|
|
Tons Refuse / Discards |
Tons Packhouse Losses * % Refuse/Discards for Packhouse Losses + Tons Unsold Buyer Rejections * % Refuse/Discards for Unsold Buyer Rejections |
= 862 tons packhouse losses * __farm_example_packhouse_loss_destinations_percent_dumping__% Refuse/Discards + 74 tons unsold buyer rejections * __farm_example_farm_unsold_buyer_rejections_percent_dumping__% Refuse/Discards
= __farm_example_tons_dumping__ tons Refuse/Discards
|
|
US Dollars Refuse/Discards |
US Dollars Packhouse Losses * % Refuse/Discards for Packhouse Losses + US Dollars Unsold Buyer Rejections * % Refuse/Discards for Unsold Buyer Rejections |
= $1,527,898 packhouse losses * __farm_example_packhouse_loss_destinations_percent_dumping__% Refuse/Discards + $131,936 unsold buyer rejections * __farm_example_farm_unsold_buyer_rejections_percent_dumping__% Refuse/Discards
= $__farm_example_us_dollars_dumping__ Refuse/Discards
|
|
Tons landfill |
Tons Packhouse Losses * % landfill for Packhouse Losses + Tons Unsold Buyer Rejections * % landfill for Unsold Buyer Rejections |
= 862 tons packhouse losses * 0% landfill + 74 tons unsold buyer rejections * 92.30% landfill
= __farm_example_tons_landfill__ tons landfill
|
|
US Dollars landfill |
US Dollars Packhouse Losses * % landfill for Packhouse Losses + US Dollars Unsold Buyer Rejections * % landfill for Unsold Buyer Rejections |
= $1,527,898 packhouse losses * 0% landfill + $131,936 unsold buyer rejections * 92.30% landfill
= $__farm_example_us_dollars_landfill__ landfill
|
|
Tons Incineration |
Tons Packhouse Losses * % Incineration for Packhouse Losses + Tons Unsold Buyer Rejections * % Incineration for Unsold Buyer Rejections |
= 862 tons packhouse losses * 0% Incineration + 74 tons unsold buyer rejections * 7.70% Incineration
= __farm_example_tons_incineration__ tons Incineration
|
|
US Dollars Incineration |
US Dollars Packhouse Losses * % Incineration for Packhouse Losses + US Dollars Unsold Buyer Rejections * % Incineration for Unsold Buyer Rejections |
= $1,527,898 packhouse losses * 0% Incineration + $131,936 unsold buyer rejections * 7.70% Incineration
= $__farm_example_us_dollars_incineration__ Incineration
|
|
Data Sources and Limitations
Planted and Harvested Acreage, Yield, and Market Price
Never Harvested (Walk-by) Causes
Maturity of Fields Never Harvested
Yield Left Behind After Harvest
Processing Rates Versus Fresh Market
Field Packing Rates
Packhouse Loss Rates
ReFED used data from the WWF Specialty Crop Losses Report[29] to quantify the percent of produce packhouse volumes that are not utilized (e.g., culls or throws). For the packhouses included in the study, 14.8%, 14.2%, and 2.6% of incoming produce was culled for tomatoes, peaches, and potatoes respectively. Because this was a one-time study conducted for a limited number of commodities, ReFED had to use extensive proxy commodity assignments and reused these estimates for every U.S. state year over year for the modeling.
Buyer Rejection Rates
Left Behind After Harvest Causes
Packhouse Loss Causes
Packhouse Loss Destinations
ReFED used data from the WWF Specialty Crop Losses Report[29] to quantify the percentage breakdown of destinations for produce that gets culled at packhouses. ReFED believes these numbers to be directionally correct, but more research is needed to confirm that this data is consistent across a larger sample size, different commodity types, different packhouses, geographies, and different times of the year.
Buyer Rejection Destinations
Based on expert interviews, ReFED assumed the following destinations breakdown for produce that gets rejected by buyers: 25% sold to discount outlets, 25% trash, 25% donations, and 25% animal feed. The portion sold to discount outlets was subtracted from the surplus total. Better data is needed in this area to replace these anecdotal estimates.
Data Quality Evaluation
DATA |
SOURCE |
DATA QUALITY SCORE |
||||||
|---|---|---|---|---|---|---|---|---|
CREDIBILITY |
UPDATE FREQUENCY |
COVERAGE |
FOOD TYPE |
GEOGRAPHY |
SCORE |
WEIGHT |
||
FARM SURPLUS DATA |
||||||||
Acres Planted |
USDA Surveys |
5 |
5 |
5 |
5 |
5 |
Very High 25/5 = 5.0 |
2% |
Acres Harvested |
USDA Surveys |
5 |
5 |
5 |
5 |
5 |
Very High 25/5 = 5.0 |
13% |
US Dollars Harvested |
USDA Surveys |
5 |
5 |
5 |
5 |
5 |
Very High 25/5 = 5.0 |
13% |
Tons Harvested |
USDA Surveys |
5 |
5 |
5 |
5 |
5 |
Very High 25/5 = 5.0 |
13% |
% Maturity of Fields Never Harvested |
ReFED Assumption |
1 |
1 |
1 |
1 |
1 |
Very Low 5/5 = 1.0 |
1% |
% Yield Left Behind After Harvest |
Farm Case Studies |
5 |
1 |
1 |
3 |
2 |
Low 12/5 = 2.4 |
40% |
Processing Rates Versus Fresh Market |
USDA Surveys |
5 |
5 |
5 |
5 |
5 |
Very High 25/5 = 5.0 |
5% |
Field Packing Rates for Fresh Market |
Public Agriculture Websites |
2 |
1 |
1 |
5 |
3 |
Low 12/5 = 2.4 |
5% |
% Packhouse Loss Rates |
WWF Specialty Crop Losses Report |
5 |
1 |
1 |
2 |
1 |
Low 10/5 = 2.0 |
5% |
% Buyer Rejections |
Expert Interviews |
1 |
1 |
1 |
1 |
1 |
Very Low 5/5 = 1.0 |
3% |
5.0 * 2% + 5.0 * 13% + 5.0 * 13% + 5.0 * 13% + 1.0 * 1% + 2.4 * 40% + 5.0 * 5% + 2.4 * 5% + 2.0 * 5% + 1.0 * 3% = 3.52 |
Medium |
|||||||
FARM CAUSES DATA |
||||||||
% Loss Due to Cause for Walk-by Fields |
USDA RMA Crop Insurance |
5 |
5 |
5 |
3 |
5 |
High 23/5 = 4.6 |
3% |
% Loss Due to Cause for Yield Left Behind After Harvest |
Farm Case Studies |
5 |
1 |
1 |
2 |
1 |
Low 10/5 = 2.0 |
87% |
% Loss Due to Cause for Packhouse Losses |
WWF Speciality Crop Losses Report |
5 |
1 |
1 |
1 |
1 |
Very Low 9/5 = 1.8 |
10% |
4.6 * 3% + 2.0 * 87% + 1.8 * 10% = 2.06 |
Low |
|||||||
FARM DESTINATIONS DATA |
||||||||
Acres Planted |
USDA Surveys |
5 |
5 |
5 |
5 |
5 |
Very High 25/5 = 5.0 |
2% |
Acres Harvested |
USDA Surveys |
5 |
5 |
5 |
5 |
5 |
Very High 25/5 = 5.0 |
14% |
US Dollars Harvested |
USDA Surveys |
5 |
5 |
5 |
5 |
5 |
Very High 25/5 = 5.0 |
14% |
Tons Harvested |
USDA Surveys |
5 |
5 |
5 |
5 |
5 |
Very High 25/5 = 5.0 |
14% |
% Maturity of Fields Never Harvested |
ReFED Assumption |
1 |
1 |
1 |
1 |
1 |
Very Low 5/5 = 1.0 |
1% |
% Yield Left Behind After Harvest |
Farm Case Studies |
5 |
1 |
1 |
3 |
2 |
Low 12/5 = 2.4 |
42% |
% of Packhouse Losses Sent to Each Destination |
WWF Specialty Crop Losses Report |
5 |
1 |
1 |
1 |
1 |
Very Low 9/5 = 1.8 |
9% |
% of Trash landfill vs incineration |
Biocycle/Columbia University Study |
5 |
2 |
4 |
1 |
5 |
Medium 17/5 = 3.4 |
1% |
% Unsold Buyer Rejections Sent to Each Destination |
Expert Interviews |
1 |
1 |
1 |
1 |
1 |
Very Low 5/5 = 1.0 |
3% |
5.0 * 2% + 5.0 * 14% + 5.0 * 14% + 5.0 * 14% + 1.0 * 1% + 2.4 * 42% + 1.8 * 9% + 3.4 * 1% + 1.0 * 3% = 3.44 |
Medium |
|||||||